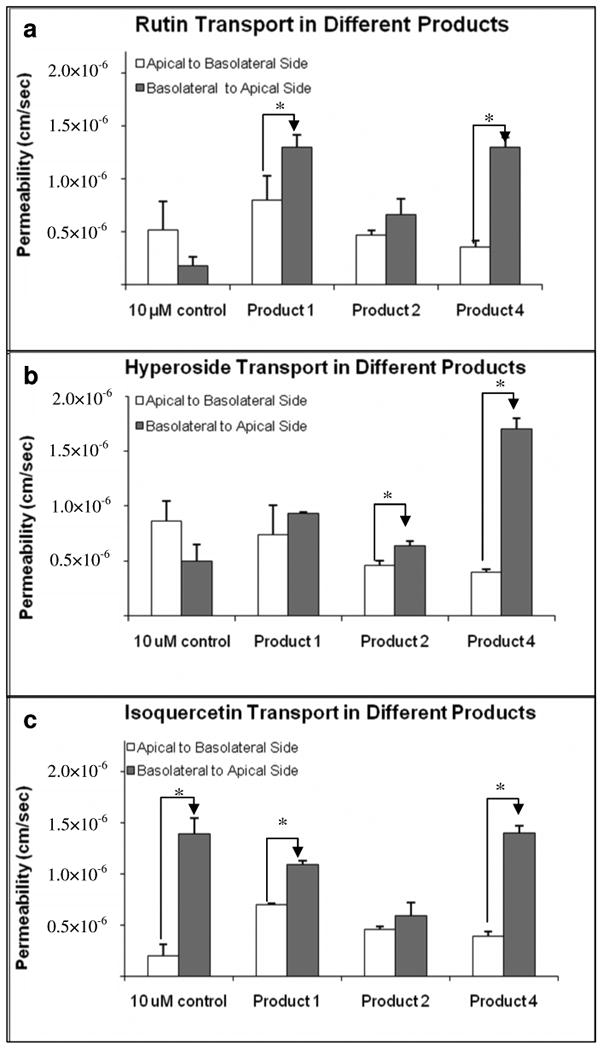
Figure 5.

Effect of product matrices on the (basolateral to apical over) apical to basolateral permeability ratios. The buffer used in both donor and receiver sides was pH 6.8. The experiments were performed at 37 °C. Each data point is the average of three determinations, and the error bar is the standard deviation of the mean. The asterisk (*) indicates a statistically significant difference between apical to basolateral and basolateral to apical transport (p < 0.05, unpaired Student T-test).
