
Figure 1.
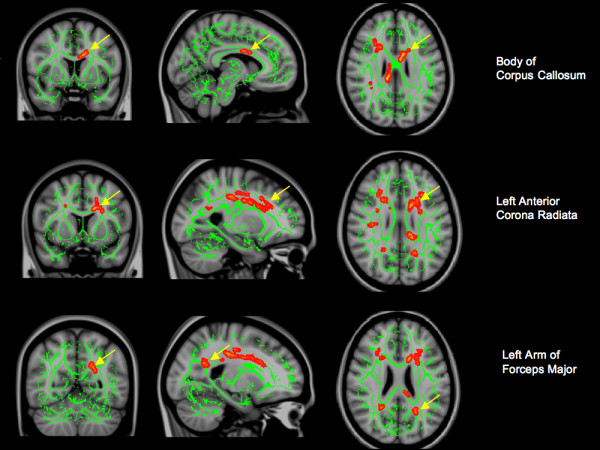
DTI differences between NPSLE, SLE, and controls. A) Significant regions (red/yellow) in which acute NPSLE patients had significantly lower FA than controls. B/C) Significant regions (red/yellow) in which acute NPSLE patients had significantly higher MD than controls. Yellow arrows indicate regions in which NPSLE patients had significantly lower FA than both SLE patients without NPSLE and controls. Left - coronal view; middle - sagittal view; right - axial view. Green represents the center of major white matter tracts.