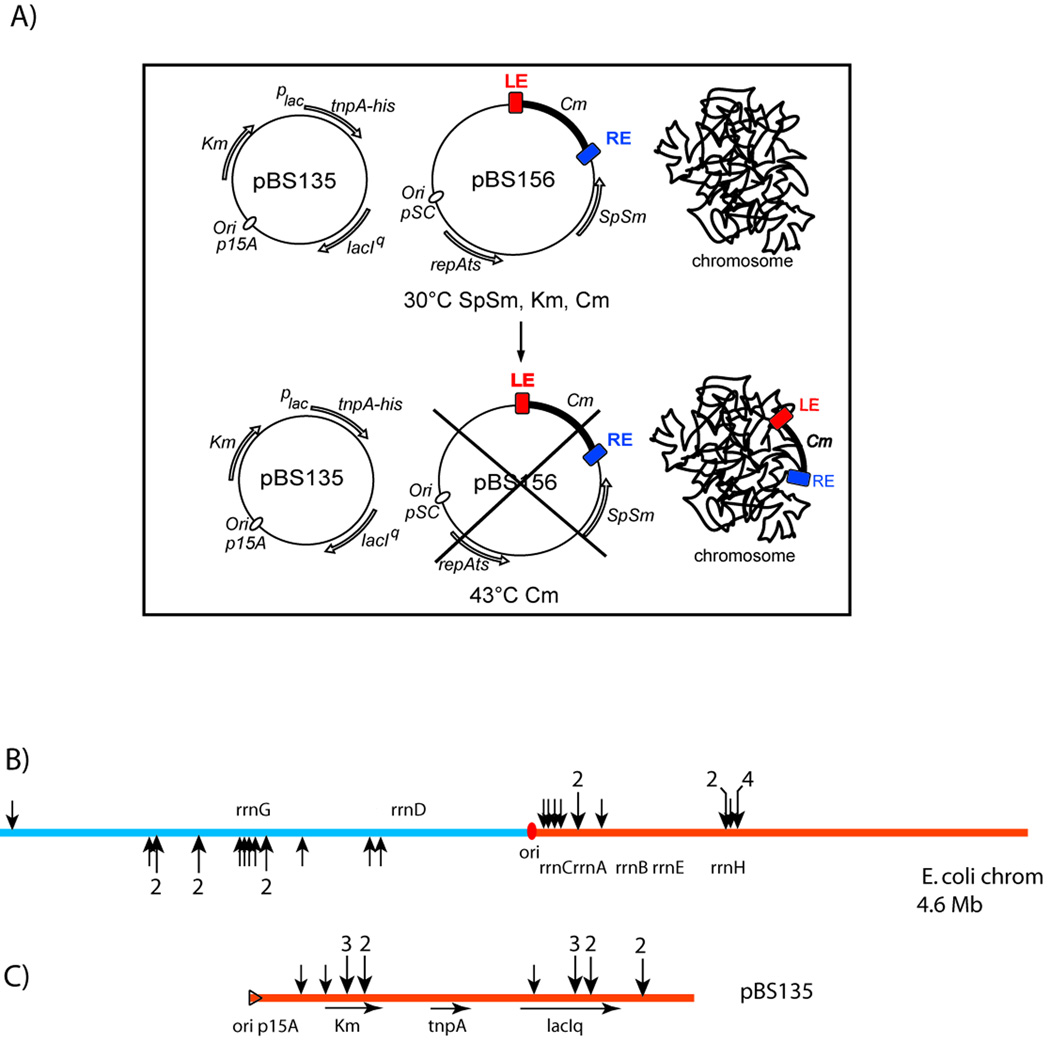
Figure 3. Insertions into the E. coli chromosome and into a resident plasmid.
A) Experimental system: The temperature sensitive transposon donor plasmid, pBS156 (middle) and the plasmid used for supplying TnpA, pBS135 (left), are shown together with a schematic of the host chromosome (right). Growth at the non-permissive temperature results in loss of pBS156 and IS insertion into the chromosome or pBS135. This is described in detail in Supplementary Material Fig. S1 and legend.
(B) Chromosomal insertions. The chromosome is shown linearised at its terminus. Red spot, origin of replication, ori; rrn, ribosomal RNA genes; black arrows, positions of insertions (Table S1). Multiple insertions are indicated by a number above the larger arrows. Replication occurs in both directions into the left and right replicores blue and orange respectively: the lagging strand template of the left (bottom) and right (top) replicores. Fisher Exact Test gives a p-value of 7.122e−6(C) Plasmid insertions. Replication of the p15A-based plasmid occurs from left to right. Orange triangle, origin of replication; KmRtnpA and lacIQ, kanamycin resistance, transposase and lac repressor genes respectively; arrows indicate their direction of transcription. Vertical arrowheads show the position of the insertions obtained from the same experiments as in (A) above.

