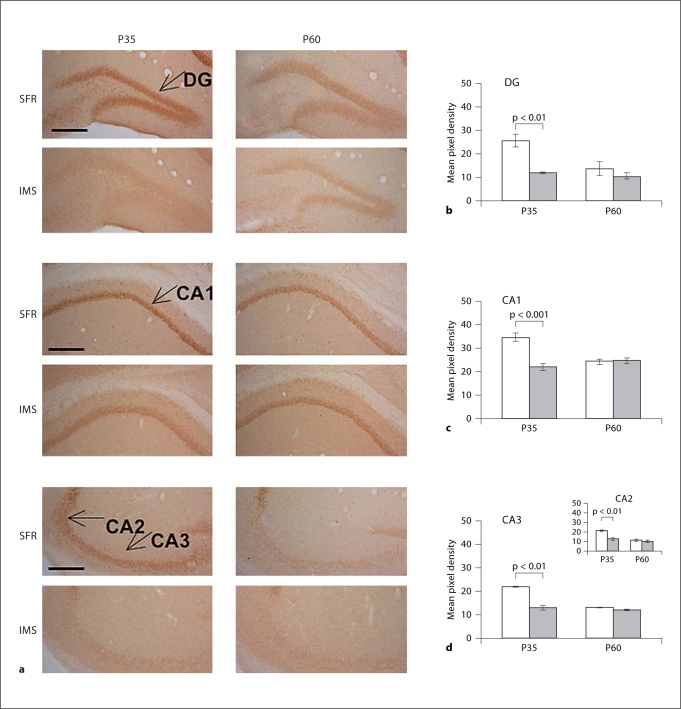
Fig. 3.
Expression of GR protein in the hippocampus of SFR and IMS Balb/c mice at P35 and P60. a Representative images of DAB-stained sections labeled with an anti-GR antibody. The hippocampal subfields are indicated. DG = Dentate gyrus. b-d Comparison of pixel densities (means ± SEM; measured for 4-6 animals per group) between SFR (white bars) and IMS (grey bars) Balb/c mice. Statistical differences revealed by one-way ANOVA [DG: F(3,20) = 8.478; CA1: (F3,20) = 14.152; CA3: F(3,20) = 61.332; p < 0.001] were resolved post hoc using Tukey-Kramer multiple comparison tests as indicated. Note the significant decrease in GR expression in all four hippocampal subfields that is only evident at P35.

