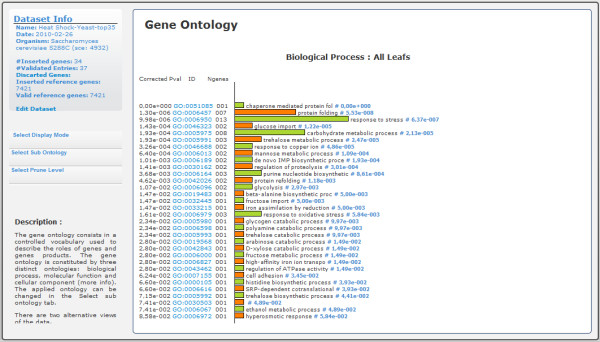
Figure 4.

GeneBrowser user-interface: gene ontology (graph view). This interface contains the graph with the list of Gene Ontology classes associated with the list of inserted genes. The graph displays the corrected p-value, the term identifiers with a link to the AmiGO database, the term name and the p-value.
