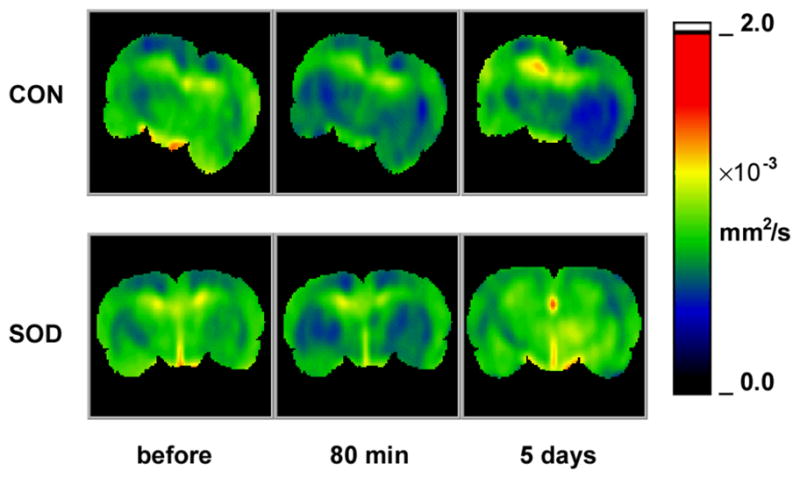
Figure 5.

Comparison of typical apparent-diffusion coefficient (ADC) maps between Cu/Zn superoxide dismutase-overexpressed rats (SOD) and the wild-type controls (CON) before cardiac arrest and 80 min and 5 d after resuscitation. ADC values, color-coded using the scale bar to the right of the images, reflect changes in ion-water homeostasis. Notice the scattered ADC abnormalities in the control rats and rapid recovery in the SOD rats.
