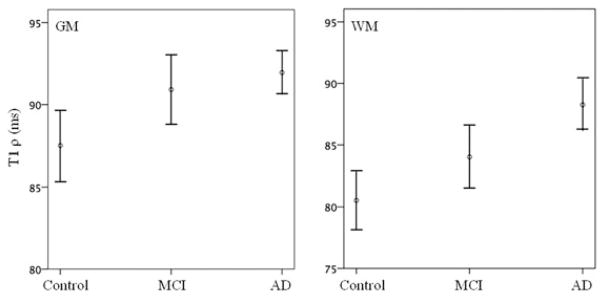
Fig 2.
The error bars (at 95% confidence interval) show mean T1ρ value in control, MCI, and AD cohorts in gray matter (GM) and white matter (WM). A 9% increase in T1ρ value was present in WM, while it was only 5% in GM in AD over control. In MCI, both GM and WM showed a 4% increase in T1ρ over control.

