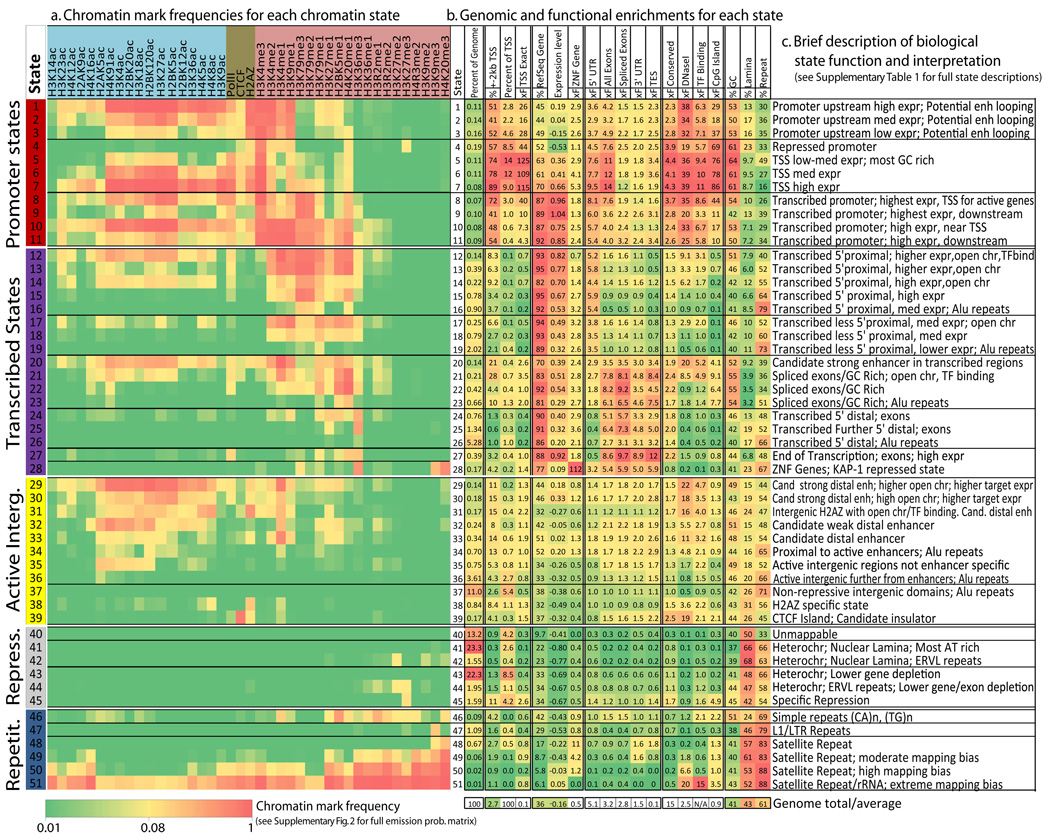
Figure 2. Chromatin state definition and functional interpretation.
a. Chromatin mark combinations associated with each state. Each row shows the specific combination of marks associated with each chromatin state, and the frequencies between 0 and 1 with which they occur (color scale). These correspond to the emission probability parameters of the Hidden Markov Model (HMM) learned across the genome during model training (values shown in Supplementary Fig. 2). Marks and states colored as in Figure 1. b. Genomic and functional enrichments of chromatin states. % denotes percentage, xF denotes fold enrichment. In order columns are: percentage of the genome assigned to the state; percentage of state that overlaps a 200bp-interval within 2kb of an annotated RefSeq Transcription Start Site (TSS); percentage of RefSeq TSS found in the state; fold enrichment for TSS; percentage of state overlapping a RefSeq transcribed region; average expression level of genomic intervals overlapping the state; fold enrichment for ZNF-named gene; fold enrichment for RefSeq 5′ Untranslated Region (5′-UTR) exon and introns; fold enrichment for RefSeq exons; fold enrichment for spliced exons (2nd exon or later); fold enrichment for RefSeq 3′ Untranslated Region (3′-UTR) exons and introns; fold enrichment for RefSeq transcription end sites (TES); fold enrichment for PhastCons conserved elements; fold enrichment for DNaseI hypersensitive sites; median fold enrichment for transcription factor binding sites over a set of experiments (expanded in Supplementary Fig. 23); fold-enrichment for CpG islands; percentage of GC nucleotides; percent overlapping experimental nuclear lamina data; percent overlapping a RepeatMasker element (expanded in Supplementary Fig. 31). All enrichments are based on the posterior probability assignments. Genome total indicates the total % of 200bp intersecting the feature or the genome average for expression and %GC. c. Brief biological state description and interpretation (‘chr’: chromatin, ‘enh’: enhancer, full descriptions in Supplementary Table 1).

