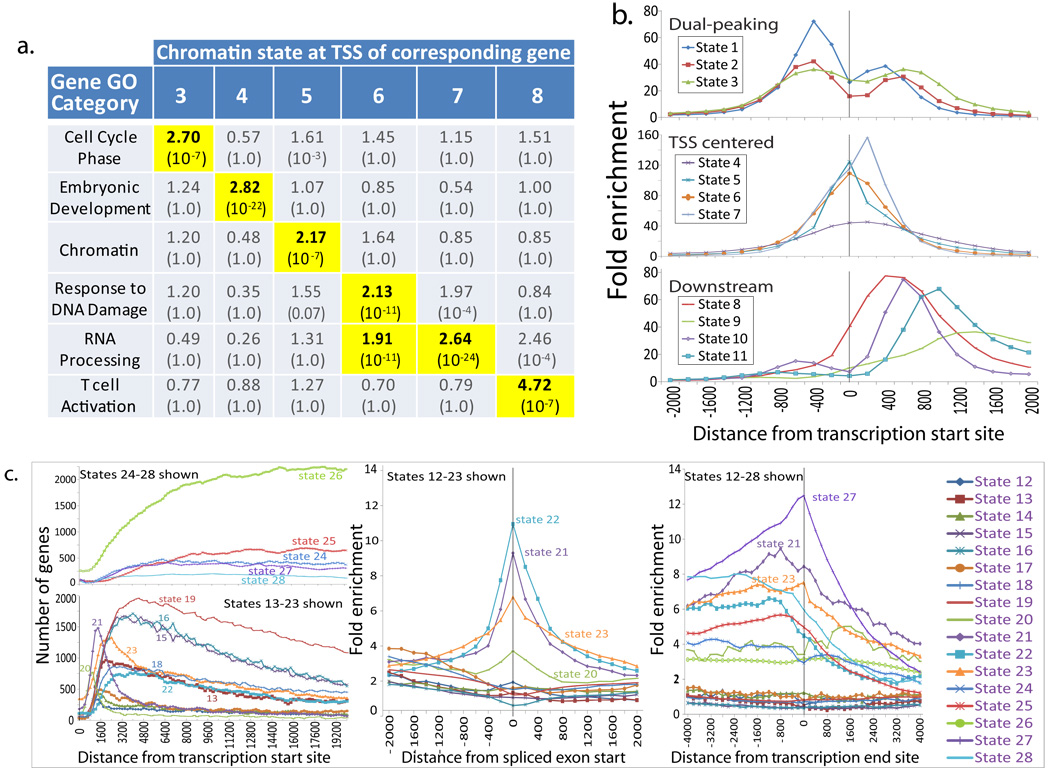
Figure 3. Promoter and transcribed chromatin states show distinct functional and positional enrichments.
a. Distinct Gene Ontology (GO) functional enrichments (fold and corrected p-values) found for genes associated with different promoter states at their Transcription Start Site (TSS). For additional states and GO terms, see Supplementary Figure 29. b. Distinct positional biases of promoter states with respect to nearest RefSeq TSS distinguish states peaking upstream, only downstream, and centered at the TSS. c. Positional biases of Transcribed States with respect to TSS, nearest spliced exon start, and Transcription End Sites (TES). These distinguish 5′-proximal states (12–23, left panel), 5′-distal states (24–28), states strongly enriched for spliced exons (middle panel, see also Supplementary Fig. 24 for plot for States 24–28), and TES-associated states (with state 27 being particularly precisely positioned, right panel).

