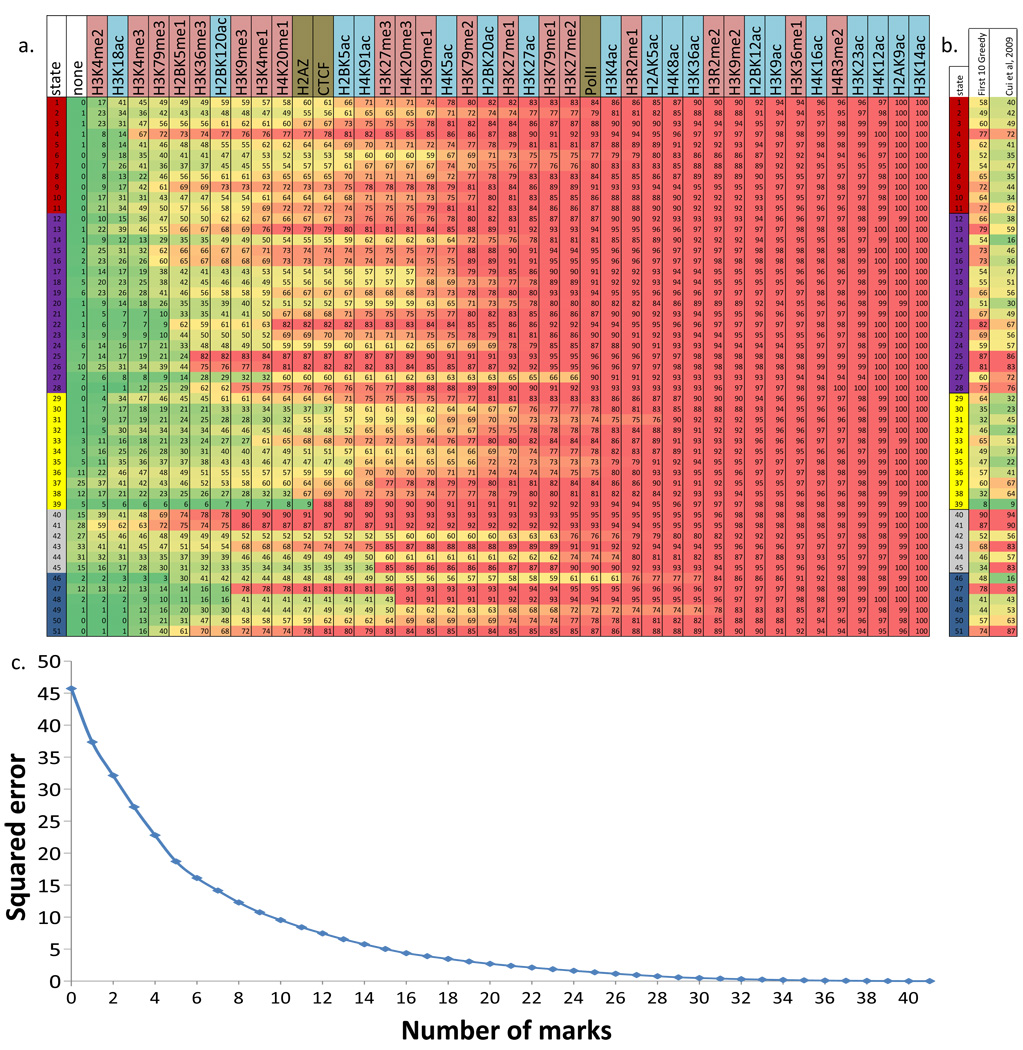
Figure 6. Recovery of chromatin states with subsets of marks.
a. The figure shows the ordering of marks based on a greedy forward selection algorithm to optimize a squared error penalty on state mis-assignments (Online Methods). Conditioned on all the marks to the left having already been profiled, the mark listed is the optimal selection for one additional mark to be profiled based on the target optimization function. Below each mark is the percentage of a state with identical assignments using the subset of marks. b. Comparison of the percentage of each state recovered between the first 10 marks based on the greedy method and the 10 marks used in (Cui et al, 2009)50 (Supplementary Fig. 39). The two columns after the state IDs are the proportion of the states recovered using the greedy algorithm and the set used in (Cui et al, 2009)50. c. The figure shows a progressive decrease in squared error for state mis–assignment as a function of the number of marks selected based on the greedy algorithm.

