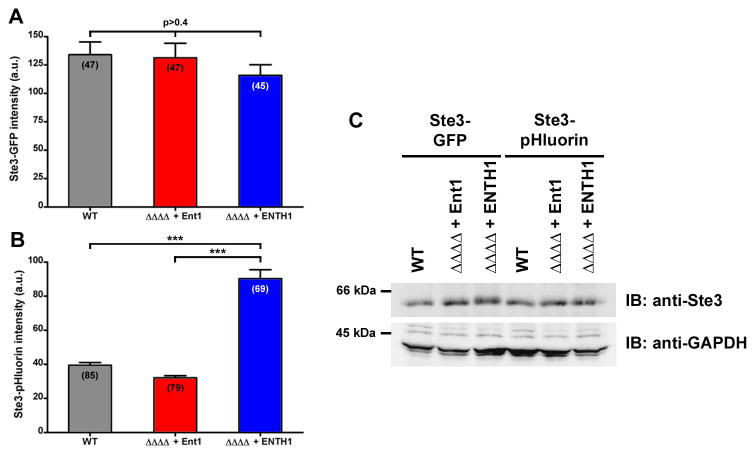
Figure 3. pHluorin used for quantification of steady-state levels of extravacuolar cargo by fluorescence microscopy.
Fluorescence intensity (in arbitrary units, a.u.) of WT, ΔΔΔΔ + Ent1 and ΔΔΔΔ + ENTH1 cells expressing Ste3-GFP (A) or Ste3-pHluorin (B). Values are presented as mean ± s.e.m., with the number of measured cells indicated in parentheses (One-way ANOVA with Tukey’s Multiple Comparison post-hoc test, ***p<0.001). (C) Western immunoblot of cell extracts from WT, ΔΔΔΔ + Ent1 and ΔΔΔΔ + ENTH1 strains tagged at the endogenous STE3 locus with either GFP or pHluorin and probed with anti-Ste3 or anti-GAPDH antibodies as indicated.

