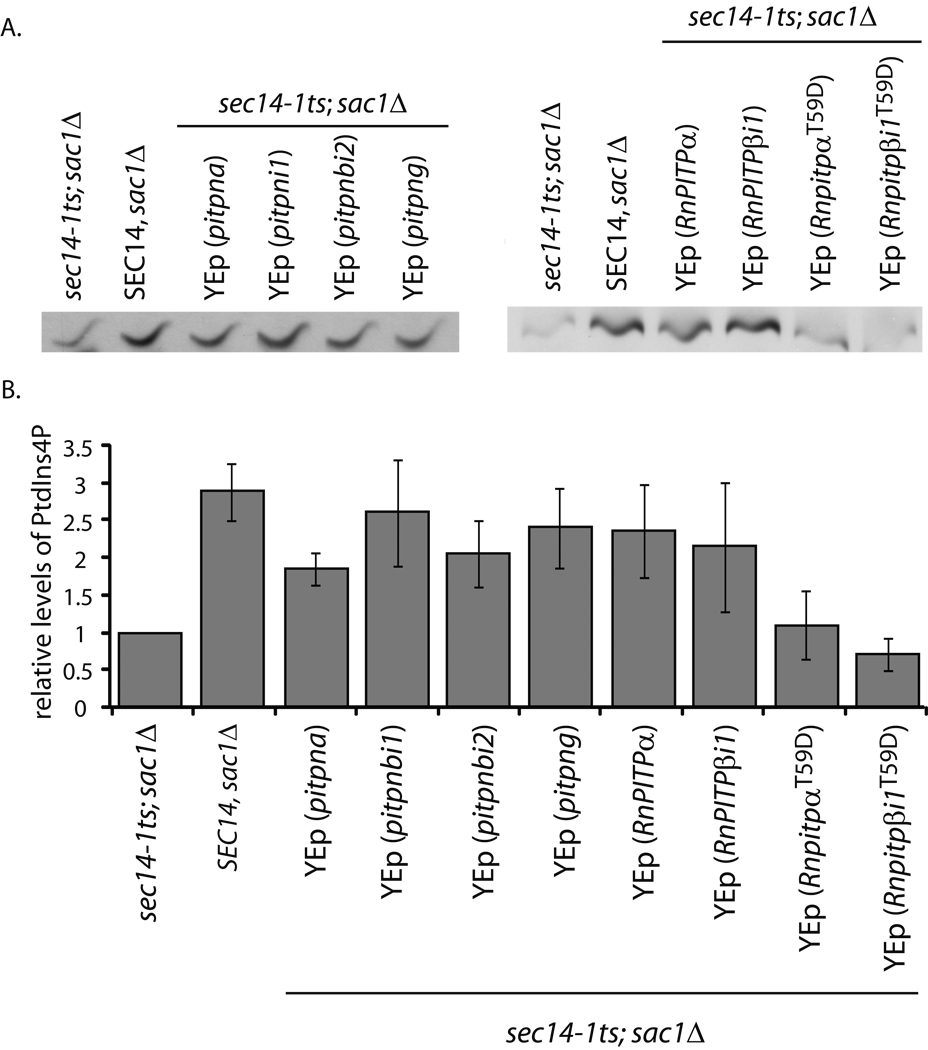
Fig. 2.
Zebrafish and mammalian class 1 PITPs stimulate phosphoinositide synthesis in yeast. (A) Yeast strain CTY100 (sec14-1ts sac1Δ; Cleves et al., 1989) carrying the YEp(URA3) parental expression plasmid pDR195, YEp(pitpna), YEp(pitpnbi1), YEp(pitpnbi2), YEp(pitpng), pDR195(RnPITPα), pDR195(RnPITPβi1), pDR195(RnPITPαT59D), and pDR195(RnPITPβi1T58D) were radiolabeled to steady-state with [3H]-inositol. Included was an isogenic SEC14 strain as positive control (CTY244; SEC14 sac1Δ; Cleves et al., 1989). After a 3 hour shift to 37°C, phospholipids were extracted, resolved by one-dimensional thin layer chromatography (Schaaf et al., 2008). The PtdIns-4-phosphate species are shown. (B) Quantification of PtdIns-4-phosphate. The PtdIns-4-phosphate band intensities as measured by densitometry were expressed as a ratio to PtdIns intensities for purposes of sample normalization, and the ratios are plotted as relative values. The PtdIns-4-phosphate/PtdIns ratio for the sec14-1ts sac1Δ (0.106496 – indicating a ca 10:1 molar ration of PtdIns to PtdIns-4-phosphate in this strain) was set to 1.0 on the relative scale. For comparison, a sec14-1ts strain exhibited a relative value of 0.20075 -- calculated from a PtdIns-4-phosphate/PtdIns ratio of 0.021379.

