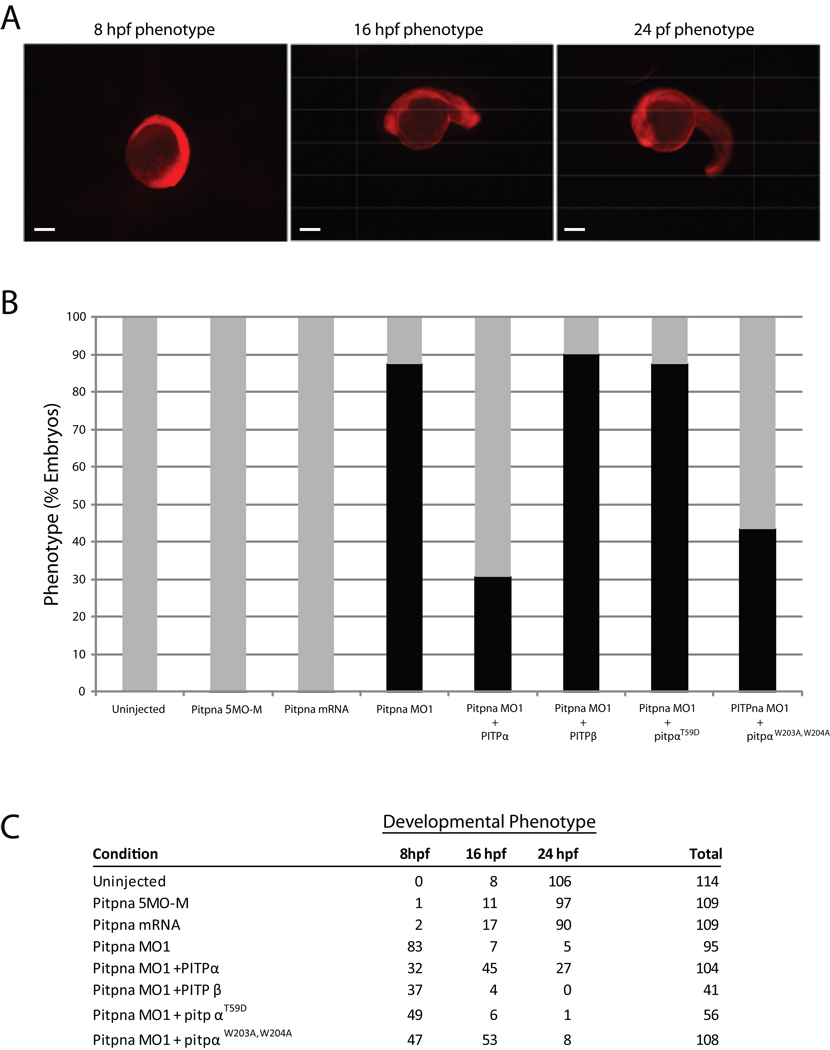
Fig. 9.
Rescue of Pitpna morphant arrest phenotype by rat PITPα. (A) Wild-type 24-,16- and 8 hpf embryos injected at the 1–4 cell stage with a lissamine-tagged Standard Control morpholino, which is not complementary to any known sequence in the zebrafish genome, are shown. The red fluorescence reveals the distribution of the morpholino throughout the embryo, and these developmental phenotypes provide the phenotypic definitions for scoring rescue. Scale bars – 270 µm. (B) Wild-type embryos were either uninjected or injected with an anti-pitpna morpholino containing 5-mismatched bases (Pitpna MO5-M), in vitro transcribed rat PITPα mRNA (PITPa RNA), anti-pitpna morpholino (Pitpna MO1), anti-pitpna morpholino and rat PITPα mRNA (Pitpna MO1 + PITPb RNA), anti-pitpna morpholino and rat PITPα mRNA (Pitpna MO1 + PITPa mRNA), anti-pitpna morpholino and rat pitpW203A, W204A RNA (Pitpna MO1 + PitpaW203A,W204A mRNA), and anti-pitpna morpholino and rat PitpT59D RNA (Pitpna MO1 + PitpaT59D RNA). Preparation of capped mRNAs is described in Suppl. Materials and Methods. Duplicate experiments were performed with each injection mixture and the data were combined from the two independent injection regimes. Gray bars represent the percentage of embryos that developed at least to the 16 hours hpf phenotype by 24 hours after each treatment. The black bars correspond to the percentage of embryos that arrested at 8 hpf developmental stage at 24 hours after each treatment. (C) The total results for each condition in (B), and from which Fig 9B was generated, are tabulated according to the developmental stage achieved by 24 hours after each treatment.

