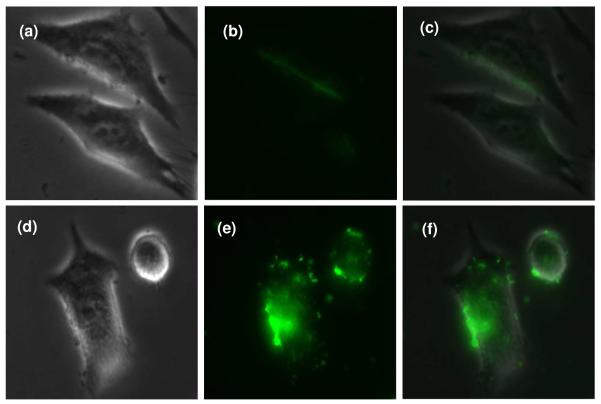
Figure 4.
Representative fluorescence microscopic images of cellular uptake of FAM-labeled siRNA complexed with G3 PPI dendrimers (a, b, c) or Au NPs modified with G3 PPI dendrimers (d, e, f). An N/P ratio of 2.4 was used and the final siRNA concentration was 0.25 μM. Incubation was 24 h at 37 °C. Light images of cells are shown in panels a and d. Detection of FAM-labeled siRNA (b and e) and overlay of images (c and f) are shown.

