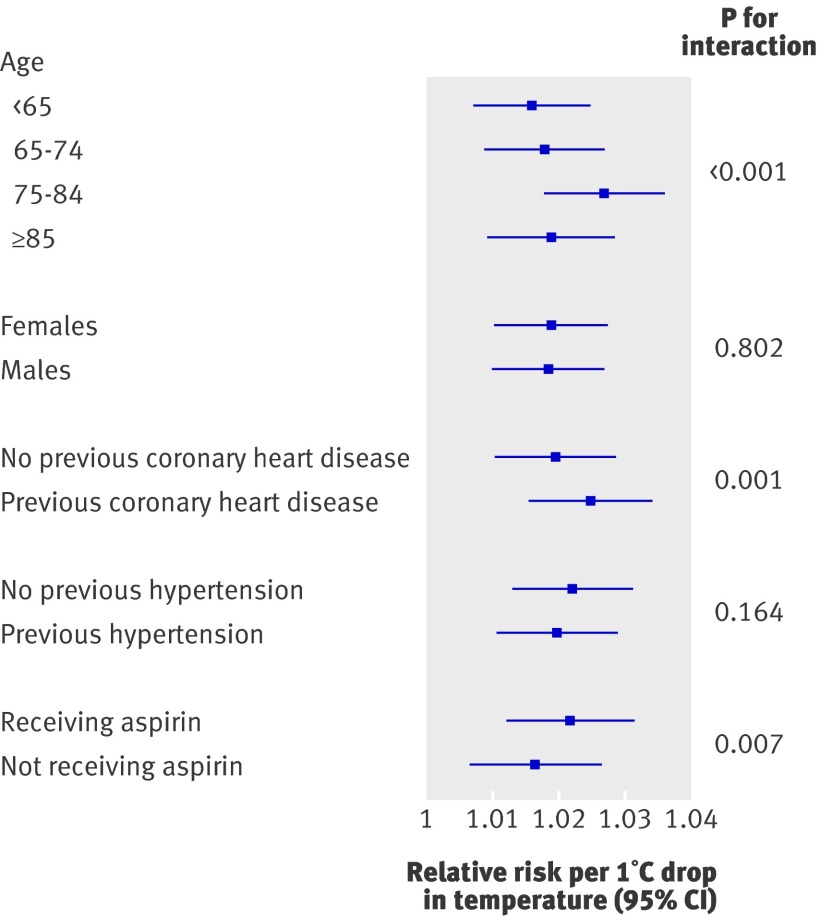
Fig 3 Estimated relative risk of myocardial infarction per 1°C reduction in temperature: effect modification by age, sex, history, and aspirin use. Graph shows estimated effect of temperature (average of lag days 0-28), adjusted for calendar time (stratified by conurbation), and fixed effects across conurbations of relative humidity (average lags 0-3), day of week, public holiday, influenza, respiratory syncytial virus, PM10 levels (lags 0-3), and ozone levels (lags 0-3)

An official website of the United States government
Here's how you know
Official websites use .gov
A
.gov website belongs to an official
government organization in the United States.
Secure .gov websites use HTTPS
A lock (
) or https:// means you've safely
connected to the .gov website. Share sensitive
information only on official, secure websites.
