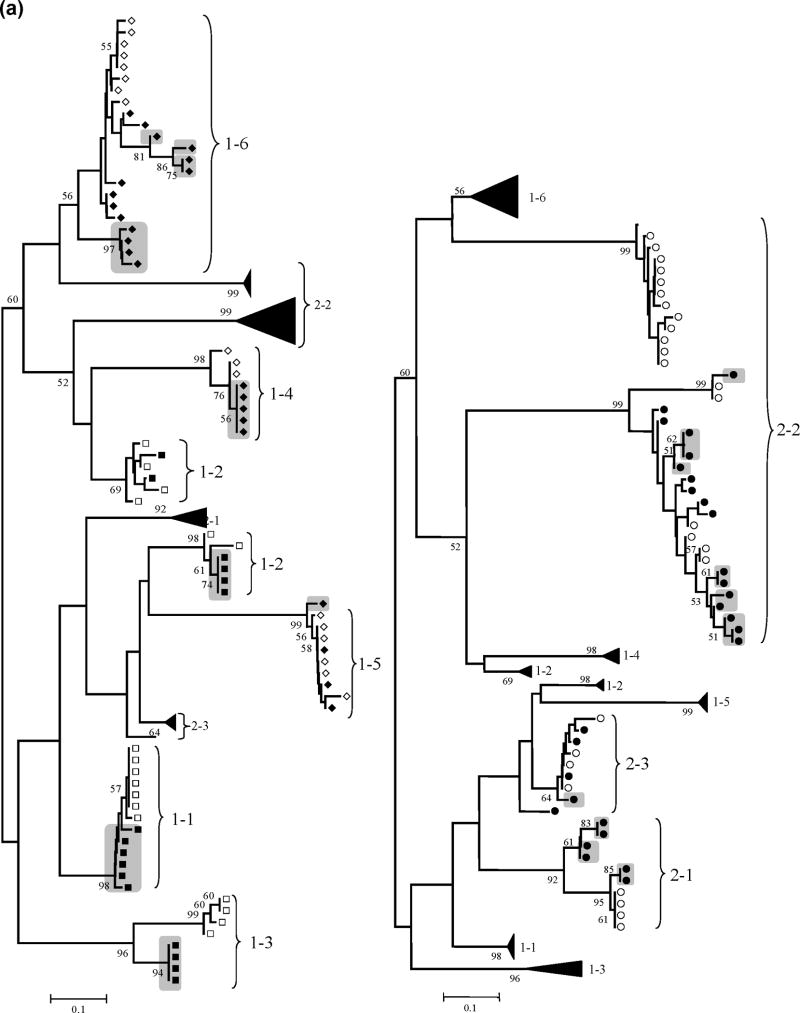
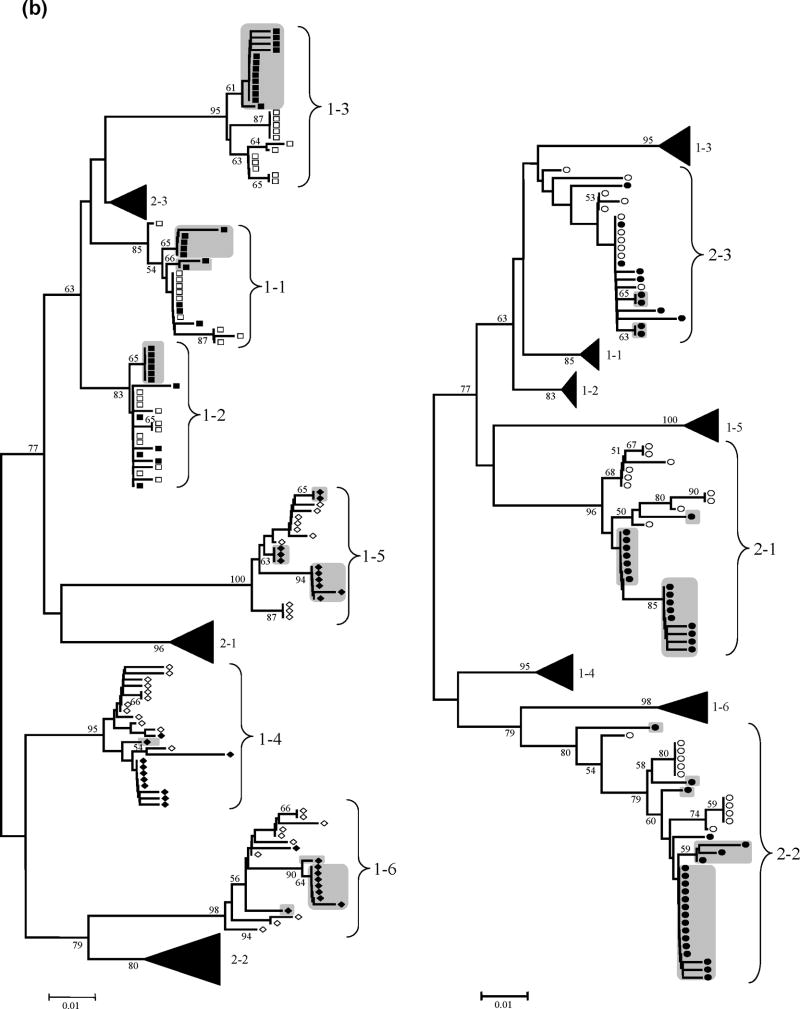
Figure 1. HCV HVR-1 and NS3 phylogenetic analyses.
Panel (a): Neighbour-Joining phylogenetic tree obtained with all HCV HVR-1 sequences from the study subjects at the two time points. (Left) Viral isolates from patient group 1 (HIV-HCV coinfected). Branches corresponding to isolates from patient group 2 are shown collapsed for clarity. (Right) Viral isolates from patient group 2 (HIV negative). Branches corresponding to isolates from patient group 1 are shown collapsed for clarity. Panel (b): Neighbour-Joining phylogenetic tree obtained with all HCV NS3 sequences from the study subjects at the two time points. (Left) Viral isolates from patient group 1 (HIV-HCV coinfected). Branches corresponding to isolates from patient group 2 are shown collapsed for clarity. (Right) Viral isolates from patient group 2 (HIV negative). Branches corresponding to isolates from patient group 1 are shown collapsed for clarity.
NOTE: Symbols: empty squares: HCV-HIV CD4<200 T0; filled squares: HCV-HIV CD4<200 T1; empty diamonds: HCV-HIV CD4>200 T0; filled diamonds: HCV-HIV CD4>200 T1; empty circles: HCV monoinfection T0; filled circles: HCV monoinfection T1; grey boxes: newly emerged variants after one-year follow-up, with bootstrap values >50 (indicated in the corresponding branches). HCV variants with bootstrap support >50% were considered divergent because the phylogenetic signal in the HCV genomic regions sequenced was relatively low.


