
Figure 3.
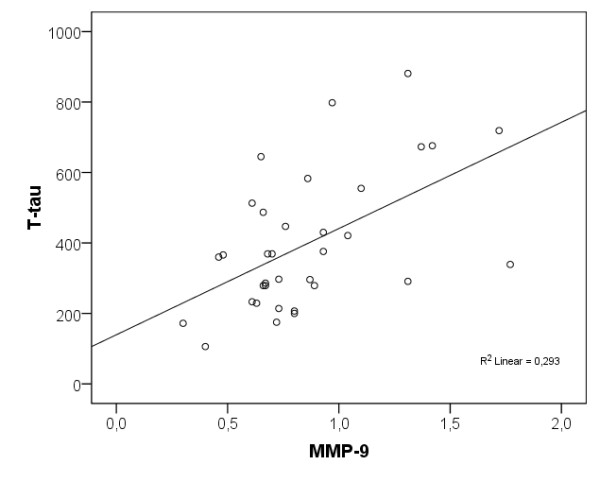
Scatter plot of CSF MMP-9 levels and CSF T-tau levels in the cognitively healthy elderly individuals. CSF MMP-9 levels are presented in ng/ml and CSF T-tau levels are presented in ng/l. CSF, cerebrospinal fluid; MMP, matrix metalloproteinase.