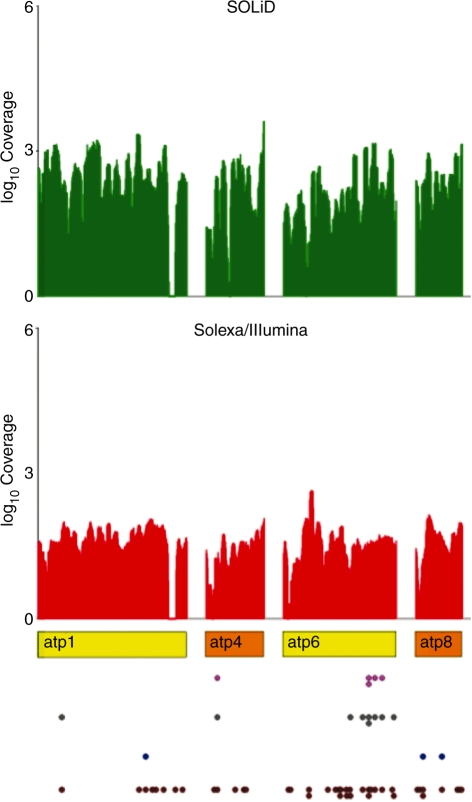
Figure 2.
Solexa/Illumina and SOLiD coverage for four mitochondrial atp genes. Plot showing the coverage depth for Solexa/Illumina and SOLiD reads in four mitochondrial genes coding for subunits of the atp synthase. Rectangles in colour indicate protein-coding genes (orange if the strand is forward and yellow if the strand is reverse). RNA editing sites are drawn as brown colored dots below each gene. Blue and grey dots designate the subset of tissue specific sites at 0.05 and 0.01 confidence levels, respectively. Sites passing the Bonferroni test at 1% confidence level are indicated in magenta. Coverage is reported in log10 scale.

