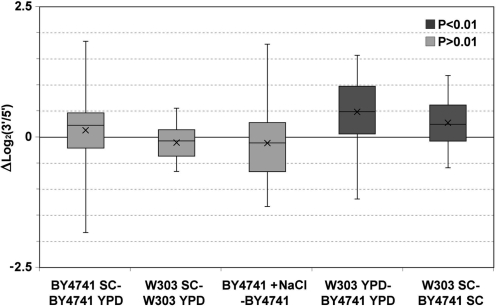
Figure 2.
Box-and-whiskers diagrams representing the increments in the 3′/5′ run-on ratios for the transcription units present in the array of highly expressed genes in the indicated strains and conditions. The diagrams summarize the data represented as scatter plots in the Supplementary Figure S5. Dark gray indicates a significant P-value.

