Figure 3.
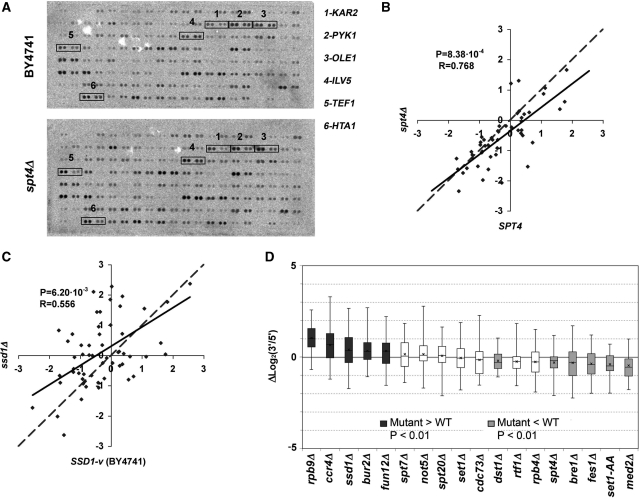
(A) Image of a typical hybridization of the array of highly expressed genes with a run-on preparation from the BY4741 wild-type strain (top) and an isogenic spt4Δ mutant (bottom). See Supplementary Figure S1 and Supplementary Table SI for probe keys. The signals of six transcriptional units, in which changes in the 3′/5′ ratio between the wild type and the mutant can be easily seen, are squared. (B) Scatter plot of the run-on 3′/5′ ratios obtained for a wild-type BY4741 strain (X-axis) and an spt4Δ mutant (Y-axis). The dashed line represents a perfect match for the X and Y values. The continuous line represents linear regression. The distance between the two lines reflects the average effect of the mutant. P-value for the Student’s two-tailed t-test for paired samples (P) and Pearson’s coefficient (R) are shown. The lower the Pearson’s coefficient of a mutant, the more gene-specific its effect on the 3′/5′ ratios. (C) The same as in (B) but for the ssd1Δ mutant. (D) Box-and-whiskers diagrams representing the increments in the 3′/5′ run-on ratios for the transcription units present in the array of highly expressed genes, in the indicated mutant, related to the corresponding isogenic wild types. The boxes representing the mutants with a significantly higher P-value are shown in dark gray, those with a significantly lower value are represented in light gray, and those with no statistically significant difference are represented in white.

