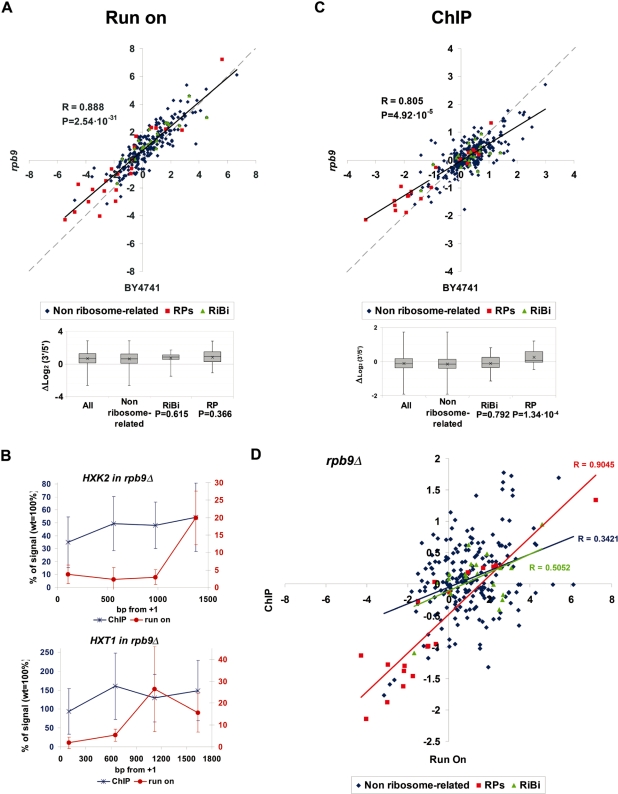
Figure 4.
(A) Scatter plot of the run-on 3′/5′ ratios obtained for a wild-type BY4741 strain (X axis) and an rpb9Δ mutant (Y axis) using the array of 377 genes. The box-and-whiskers diagrams summarize the rpb9Δ/wild-type differences for the genes belonging to the indicated gene categories. The effect of rpb9Δ on RP and RiBi genes, relative to non ribosome-related genes, was challenged with the Student’s two-tails t-test for samples with unequal variances; P-values are shown underneath. The other details are as in Figure 3B. (B) Comparison of the run-on profile (red) and the RNA pol II ChIP profile (blue) of the rpb9Δ mutant (relative to the wild-type profile) in HXK2 and HXT1. Error bars represent standard deviation. (C) The same as in (A) but for the RNA pol II 3′/5′ ratios. (D) Scatter plot of the average run-on and ChIP 3′/5′ ratios of rpb9Δ corresponding to the genes represented in the 377 genes array. Linear regressions and their corresponding Pearson’s coefficients are shown.

