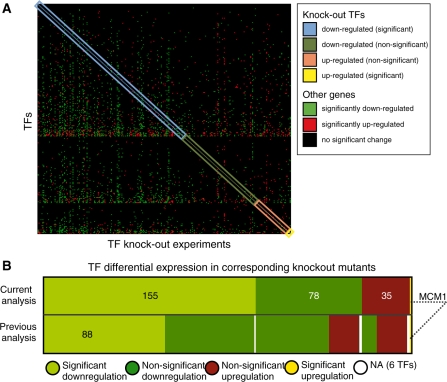
Figure 2.
Most TFs are significantly depleted in the corresponding knockout mutants. (A) Heat-map of TF expression levels in 269 knockout mutants. Intersecting cells are coloured according to changes in expression values relative to wild-type: significantly up-regulated (red), significantly down-regulated (green) and no change (black). Cells on the diagonal indicate the expression levels of the TFs in their own knockout mutants. Blue cells on the diagonal represent 155 TFs that display lower expression in their own knockout. In the original analysis there were only 88 such TFs. Dark green cells on the diagonal show 78 TFs with a negative, although non-significant, fold-change in the deletion assay. Orange cells on the diagonal represent 35 TFs with positive fold-change (non-statistically significant). Finally, a single yellow cell on the diagonal represents MCM1, which is significantly up-regulated. (B) Comparison of TF differential expression in the current (top row) and original analysis (bottom row). Cells are coloured according to the differential expression of each TF in its own knockout mutant. Light green cells represent TFs whose expression is statistically significantly depleted (155/88 TFs in current/original analysis). Dark green cells show TFs with a negative, although non-significant, fold-change in the deletion assay (78/131 TFs in current/original analysis). Dark red cells represent TFs with positive non-significant fold-changes (35/43 TFs in current/original analysis). White cells represent six TFs that had undetermined (NA) fold change values in the original analysis. Finally, a single yellow cell represents MCM1, which is significantly up-regulated in both analyses.

