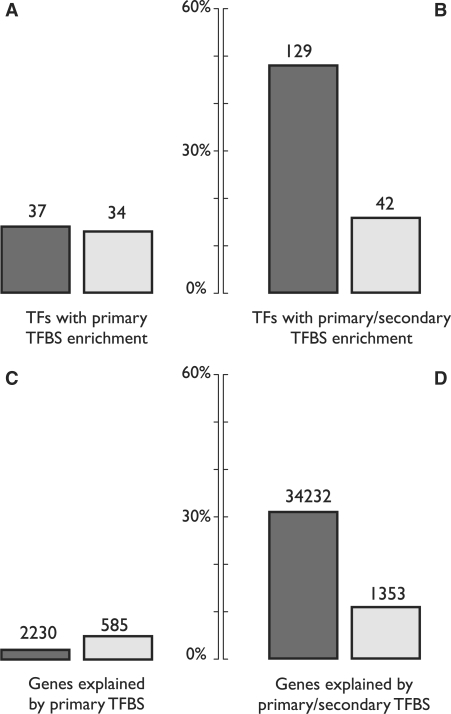
Figure 4.
Enrichment of TF-binding sites upstream of target genes. (A) Proportion of TFs whose target genes are enriched in binding sites for the knockout TF itself. Binding site data are available for 142 TFs (see ‘Methods’ section). Only primary TF knockout-target gene interactions are considered. (B) Proportion of TFs whose target genes are enriched in binding sites for the knockout TF itself, as well as for TFs that are among the set of differentially expressed genes in the TF deletion mutant, i.e. this measure considers both primary regulatory interactions, as well as secondary ones in the regulatory cascade. (C) Proportion of differentially expressed genes that can be explained by binding events. Only primary TF knockout-target gene interactions are considered. (D) Proportion of differentially expressed genes that can be explained by binding events including regulatory cascades. Results from the current analysis are shown in dark grey; previous analysis results are shown in light grey. Absolute numbers of TFs and target genes are indicated above the bar-plots.

