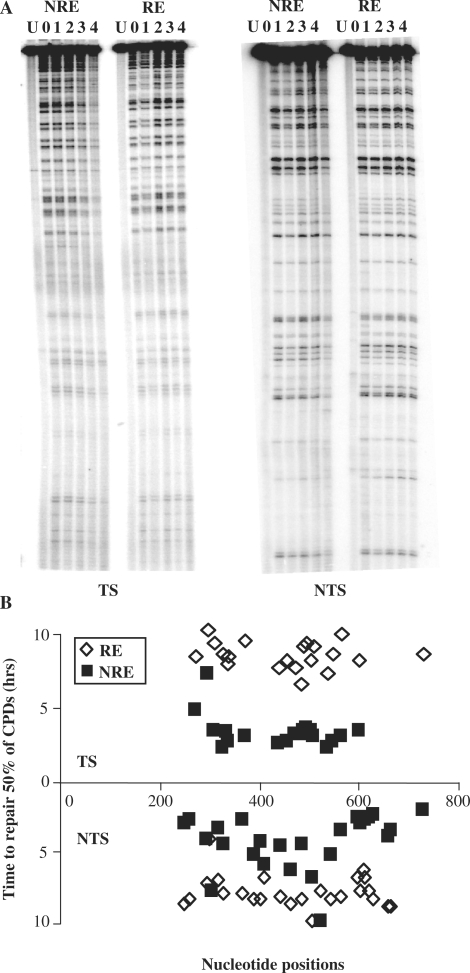
Figure 3.
The repair of CPDs in the TS and NTS of URA3 at the NRE and RE. (A). Gels depicting the incidence of CPDs in the MseI fragment of URA3 in the NRE and RE. U, UV-untreated samples; 0, samples that were UV treated but without repair time; 1–4, UV-treated samples that were allowed to repair the damage for 1–4 h. (B) Graph representing the repair rate for individual CPDs at each nucleotide position for the NRE and RE. The repair rate is represented as the time required to remove 50% of the initial damage (T50%).

