Figure 7.
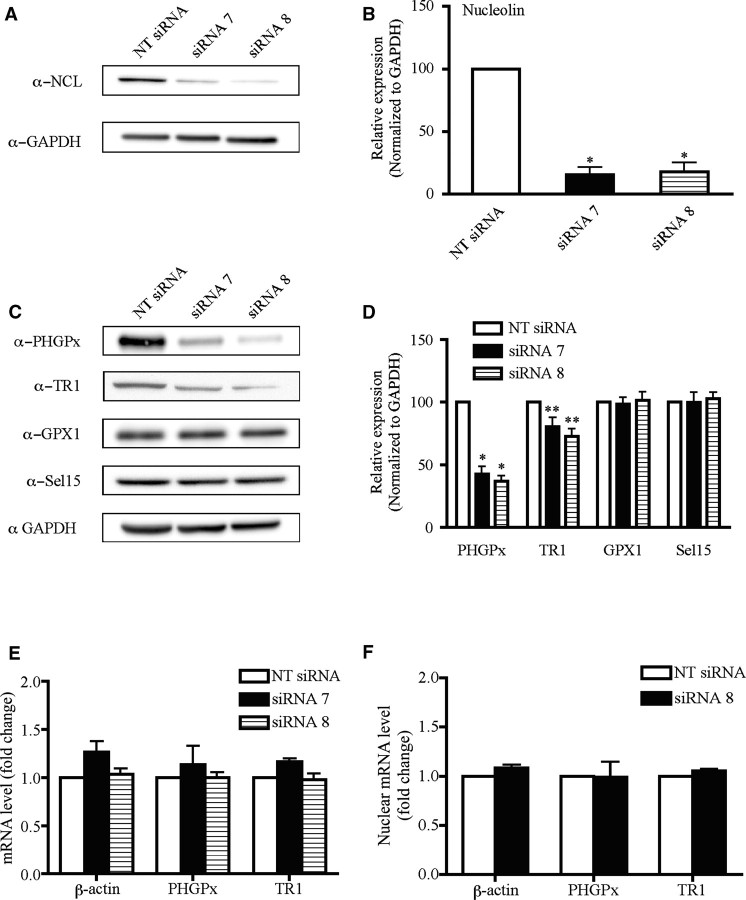
Selective inhibition of PHGPx and TR1 expression due to siRNA knockdown of nucleolin. (A) McArdle 7777 cells were treated with siRNAs directed against nucleolin (siRNA 7 and 8) or a NT siRNA for 96 h as described in 'Materials and Methods' section. Cell lysates were analyzed by western blotting using the indicated antibodies. (B) Quantitation of the western blot data from three independent experiments. The results were normalized to GAPDH and are represented as mean ± SEM. Asterisks indicate significant change in protein expression for the nucleolin siRNA treated cells relative to the cells treated with the NT siRNA (single asterisk indicates P < 0.001). (C) As described in (A), cell lysates were analyzed by western blotting using the indicated antibodies. The PHGPx and GPx1 antibodies also recognize two non-specific bands of 34 and 52 kDa, which are not shown in this figure but did not change with siRNA treatment. The bands shown in the figure correspond to the specific bands for PHGPx and GPx1 proteins at 20 and 26 kDa, respectively. (D) Quantitation and statistics were performed as described in (B) (single asterisk indicates P < 0.001, double asterisk indicates P < 0.05). (E) Effect of nucleolin manipulation on PHGPx and TR1 mRNA levels. Total RNA was isolated from McArdle 7777 cells treated with nucleolin siRNAs 7 and 8 or the NT control for 96 h. The levels of β-actin, PHGPx and TR1 mRNAs were quantified by qRT-PCR. The results were normalized to GAPDH and expressed as fold-change. The data represent the mean from at least three independent analysis ± SEM. (F) Transcript levels in nuclear extracts were quantified by qRT-PCR as described in (E).

