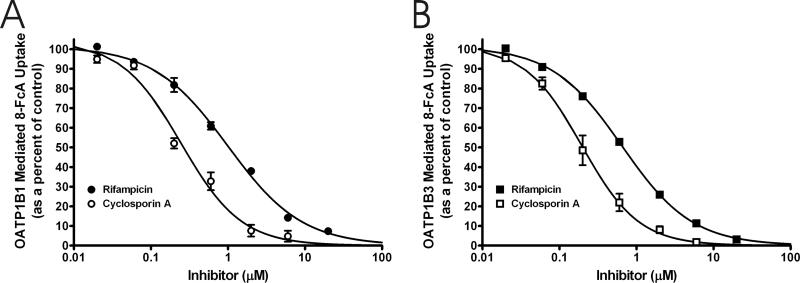
Figure 7.
The IC50 determination for cyclosporin A (open symbols) and rifampicin (filled symbols) versus 8-FcA for OATP1B1 (A) and OATP1B3 (B). The IC50 values for cyclosporine A and rifampicin against OATP1B1 mediated transport were 0.25 μM, and 0.99 μM, respectively. The IC50 values for the same inhibitors against OATP1B3 mediated transport were 0.20 μM, and 0.65 μM. Data represent the mean and standard error of two experiments where each concentration was performed in triplicate.

