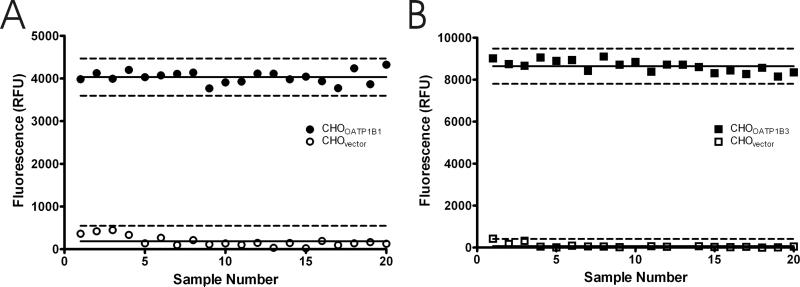
Figure 8.
Assay data from 20 replicates of CHOvector and CHOOATP1B1 (A), and CHOvector and CHOOATP1B3 (B). The mean of each data set is indicated by the solid horizontal line. The broken lines represent three standard deviations from the mean. The calculated Z’-factor was 0.79 for the OATP1B1 assay and 0.86 for the OATP1B3 assay.

