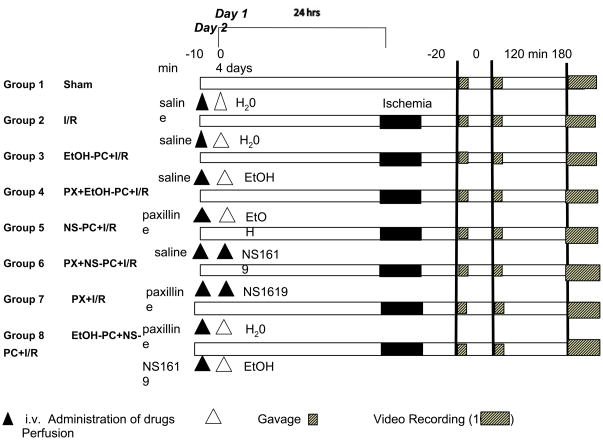
Figure 1.
Diagram of the experimental protocols assigned to each group. The numbers at top in minutes refer to the timeline of the protocol on day 1, 24 hrs before ischemia/reperfusion (I/R), day 2, the day of I/R, and day 4, the day of brain perfusion and fixation. Black triangles indicate administration of saline or drugs. White triangles indicate gavages of water or EtOH. Solid black bars indicate the 20-min period of ischemia during which both CCA had no blood flow. Short hatched bars indicate digital video recording (10 min) and long hatched bars indicate perfusion transcardially. Two sets of experimental groups, each encompassing all treatments were used: one group was used for intravital microscopic studies of leukocyte rolling and adhesion in pial postcappilary venules at both 2 and 3 hrs of reperfusion. The other group was used for histological examination of hippocampal injury at 4 days of reperfusion. See text for further details and definition of groups.

