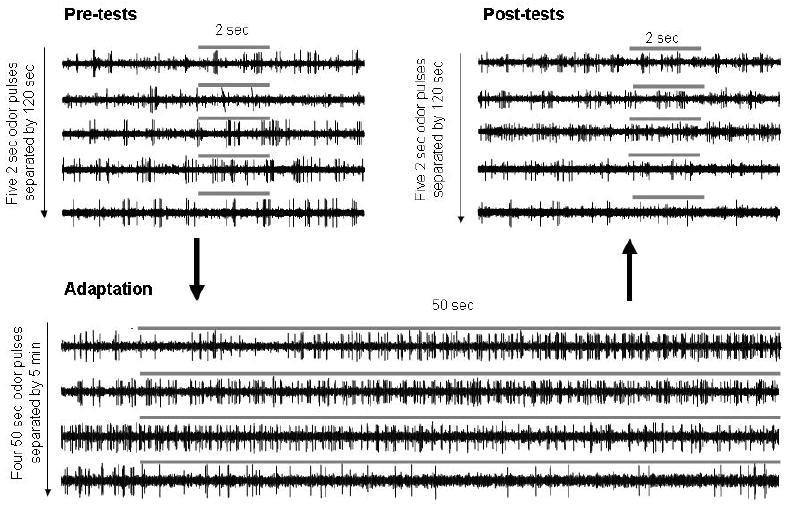
Figure 2. Individual mitral cell responses to one odor over the course of the recording protocol.

Raw recorded data from one mitral cell are shown during pre-tests (five 2-second odor presentations separated by 2-minute ITIs), followed by four 50-second adaptation stimuli with the same odorants separated by 5-minute ITIs (adaptation), followed 5 minutes later by a second series of five 2-second odor stimuli separated by 2-minute ITIs. Gray bars indicate odor stimulation times and durations.
