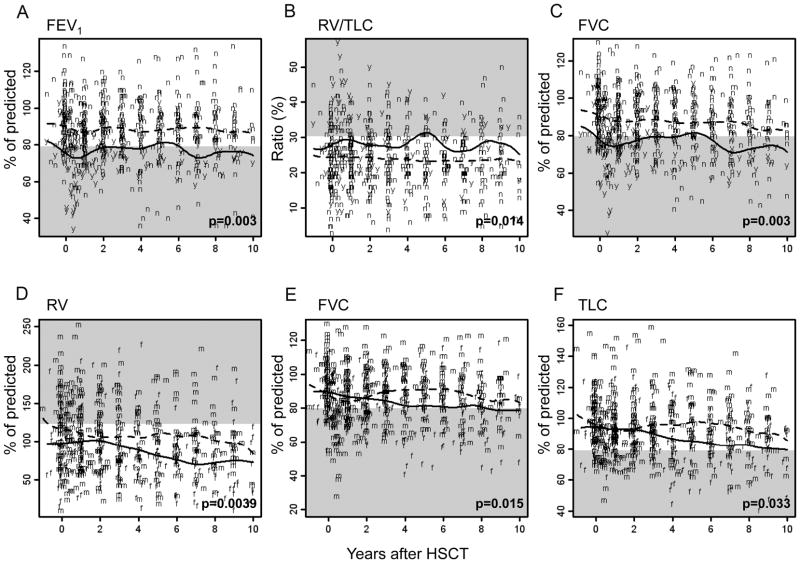
Figure 3.
Changes in pulmonary function over time on the basis of respiratory event within 1 year post–allo-HSCT (a–c) and sex (d–f). Raw data and 50th percentiles are plotted. Solid lines depict patients with respiratory events (“y” letters) or female sex (“f” letters), and dotted lines represent patients without respiratory events (“n” letters) or male sex (“m” letters). Abnormal ranges are shown in gray.

