
Figure 7. BDNF and GDNF expression in the retina are down-regulated by the tubby gene and up-regulated by the presence of the Trx transgene.
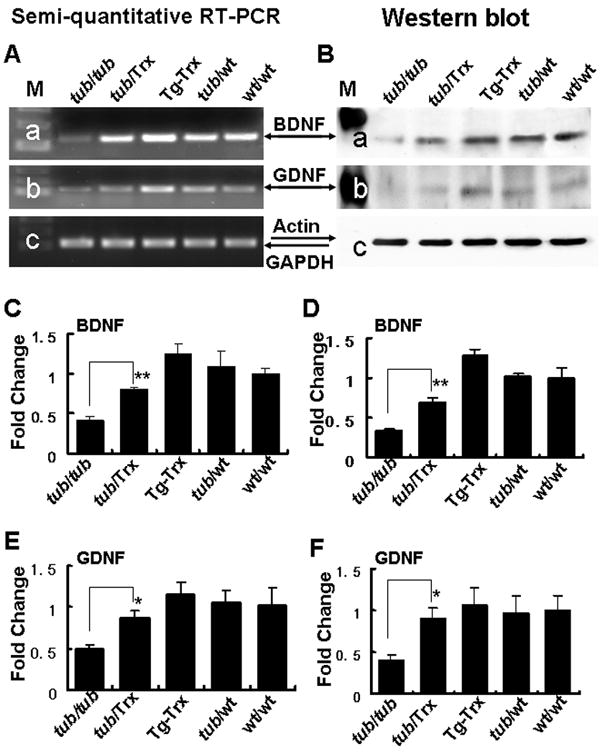
Representative results of (A) Semi-quantitative RT-PCR and (B) Western blot analysis shows significant decreases in BDNF (a) and GDNF (b) mRNAs and proteins in the retinas of Tubby mice at 14 days. Densitometric analysis of BDNF (C) semi-quantitative RT-PCR and (D) Western blot bands confirm the band displays in A and B. Similar analysis of GDNF bands (E) and (F) confirm the observed changes. Intensity of each band was standardized by the band intensity of GAPDH or actin. Data are expressed as mean ± SD (n=3 in each group). The * and ** indicate p<0.05 and p<0.01.