
Fig. 11. Time lapse imaging of infected neurons.
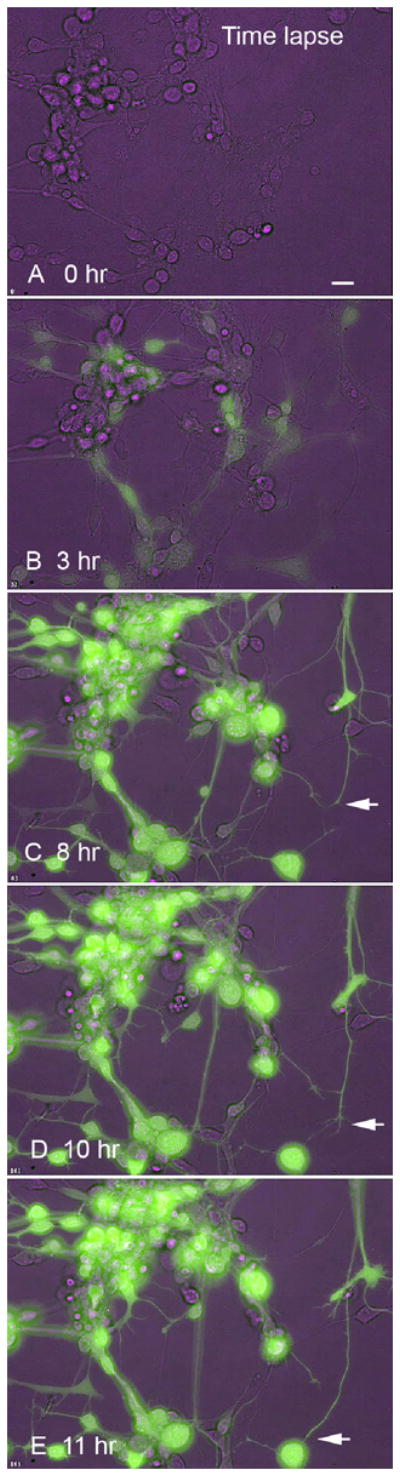
This is a series of time-lapse images after infection with dG-VSV at time 0. Infected cells are noted by their green fluorescence, and other cells are visualized by phase contrast in purple. A – E shows the same microscope field over 11 hrs. Note the increase in fluorescence over time, the mobility of the cells as they change position, the normal morphology, and the extension and exploration of the culture dish by the growing neurite expressing virally expressed GFP denoted by the white arrow. Bar, 15 um.