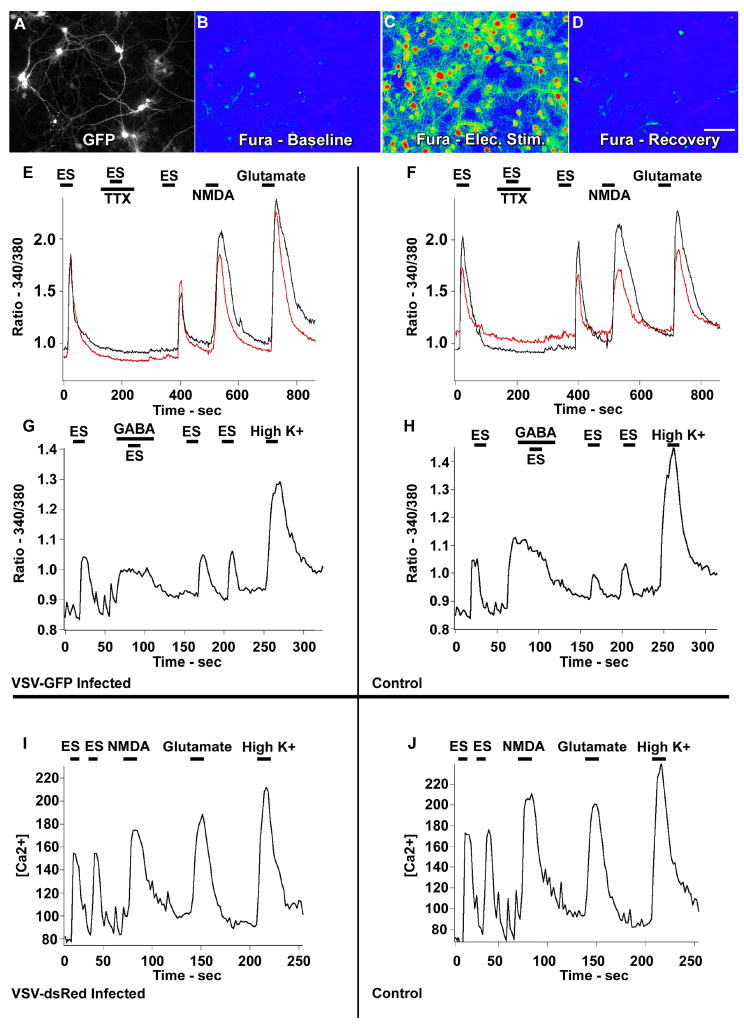
Fig. 9. Calcium digital imaging with fura-2 of cells infected with dG-VSV.
A-D Same field showing cultured neurons; A shows infected cells showing GFP expression. B-D are pseudocolor images of fura-2 ratiometric images of 340/380 nm excitation calibrated to known Ca2+ levels. B,C, and D show baseline. B, electrical stimulation (ES) increases calcium levels (C), and recovery after electrical stimulation is stopped D. E,G. Calcium traces from dG VSV-GFP infected neurons showing GFP expression (E,G) and control cells showing no GFP (F,H) respond similarly to ES, ES in TTX (0.5 uM), NMDA, Glutamate, GABA, GABA in TTX, and High K+. I shows a representative Ca2+ trace of dG-VSV-dsRed infected neurons responding to ES, NMDA, Glutamate and High K+. J shows corresponding trace of dsRed-negative control neurons responding similarly to the same stimuli as (I).

