Figure 8.
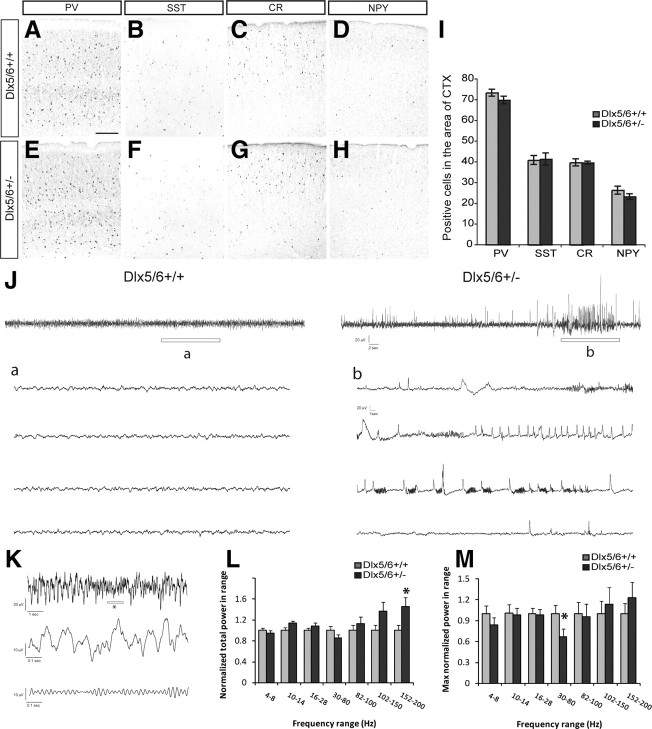
Dlx5/6+/− mice show spontaneous electrographic seizures and reduced maximum gamma power in the absence of gross histological abnormalities. A–H, Expression of PV, SST, CR, and NPY in somatosensory cortex of Dlx5/6+/+ and Dlx5/6+/− littermates. Scale bar: (in A) A–H, 200 μm. I, Quantification of PV+, SST+, CR+, NPY+ cells within a region of 380,000 μm2 of the somatosensory cortex. J, Sample EEG traces obtained during daytime recordings from freely moving adult Dlx5/6+/+ and Dlx5/6+/− mice. Top, Sixty-second-long EEG recordings. Bottom, Enlargement of region indicated by a or b in the top trace. Note the presence of an abnormal epileptiform-like electrographic discharge in b. Scale bars (in b) a, b, top, 20 μV, 2 s; bottom, 20 μV, 1 s. K, Sample EEG traces used for power analysis. Top, Ten-second-long EEG recording from a Dlx5/6+/+ mouse. Middle, Enlargement of region indicated by an asterisk in the top trace. Bottom, Same as middle, but filtered between 30 and 80 Hz. L, Total power as a function of frequency band for Dlx5/6+/+ or Dlx5/6+/− mice. For each frequency band, total power was normalized by the mean total power in Dlx5/6+/+ mice. Each bar represents an average over four mice from each group, five 60 s epochs from each mouse, and two EEG recording sites (n = 40 per group). M, Maximum power within each frequency band for Dlx5/6+/+ or Dlx5/6+/− mice. For each mouse, we selected the 60-s epoch with the most power in each frequency band. Each bar represents an average over four mice from each group, and two EEG recording sites in each mouse (n = 8 per group). *p < 0.05 by one-way ANOVA.

