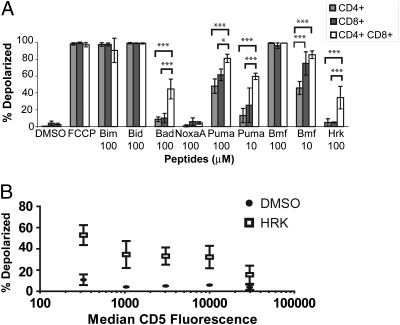
Fig. 4.
FACS BH3 profiling reveals developmentally controlled priming of thymocytes. (A) Data are the average of three independent experiments and error bars indicate the SD. *P < 0.05 and ***P < 0.001 as determined by two-way ANOVA. (B) DP thymocytes were stained with CD5 as a marker of maturation. Loss of HRK sensitivity corresponds with CD5 expression and the loss of BCL-XL dependence. n = 3. Bars indicate SD.

