Fig. 1.
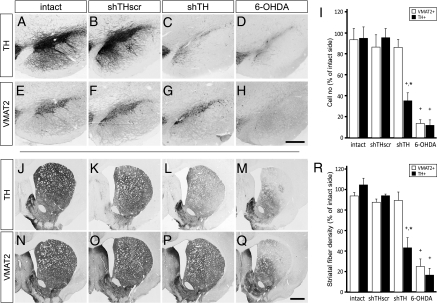
Long-term down-regulation of TH by rAAV-mediated shRNA expression in the SN and striatum. Both TH and VMAT2 phenotypic markers were maintained at normal levels (intact; A, E, J, and N) after expression of scrambled control sequence (shTHscr; B, F, K, and O), whereas in the active knockdown group (shTH), TH protein was selectively reduced in the cell bodies (C) and at the fiber terminals (L), whereas the VMAT2 expression remained unchanged (G and P) In the 6-OHDA lesioned rats, on the other hand, neurodegeneration in the SN was accompanied with loss of both TH (D and M) and VMAT2 (H and Q) immunostaining. The magnitude and specificity of the down-regulation in TH enzyme is shown by stereological quantification of TH and VMAT2-positive cell numbers in the SN (I) and semiquantitative optical densitometry measurements in the striatum (R). Data are analyzed by two way factorial ANOVA [I, group vs. phenotypic marker effect F(7,27) = 16.497, P < 0.0001; R, group vs. phenotypic marker effect F(7,27) = 26.841, P < 0.0001], followed by Tukey's HSD post hoc. Error bars represent ± SEM. *Different from intact and shTHscr control group within the same phenotypic marker; +TH-positive cells or fiber density different from the corresponding VMAT2-positive cells or fiber density in the same group. [Scale bars, 50 μm (in H for A–H) and 100 μm (in Q for J–Q).]

