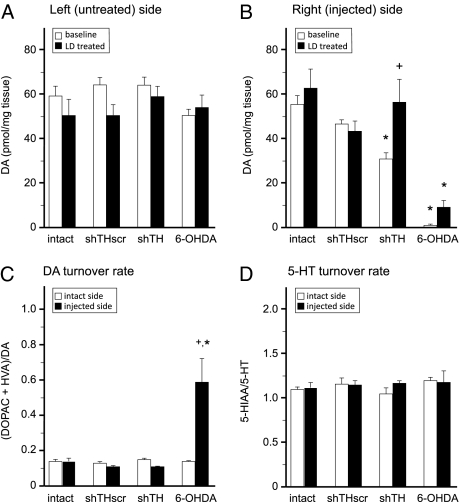
Fig. 2.
Quantification of monoamines in striatal tissue samples using HPLC. Two groups of animals were analyzed to determine the concentrations of DA and its metabolites under baseline conditions or following L-DOPA treatment on the uninjected control side (A) and injected side (B). In addition the turnover rate for DA (C) and 5-HT (D) were calculated. Data are analyzed by two-way factorial ANOVA [B, treatment vs. group effect F(7,37) = 13.479, P < 0.0001; C, group vs. side effect F(7,41) = 5.194, P < 0.0001], followed by Tukey's HSD post hoc test. Error bars represent ± SEM. *Different from intact and shTHscr control groups within the same condition (A and B) or side (C and D). +Different from baseline condition (B) or intact side (C).

