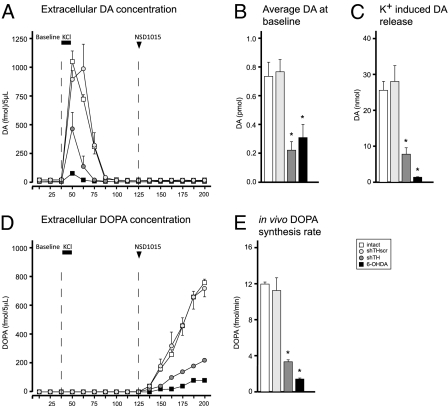
Fig. 3.
Online in vivo microdialysis. Baseline (B) and KCl-induced (C) DA release were estimated by calculating the area under the curve in A at the respective time intervals. In the third phase, the animals received a systemic injection of NSD-1015, and in vivo accumulation of DOPA was monitored via the microdialysis probe (D) to estimate the DOPA synthesis rate (E). Statistical comparisons were performed by one-way ANOVA [B, F(3,10) = 11.975, P < 0.01; C, F(3,10) = 19.354, P < 0.0001; E, F(3,10) = 126.806, P < 0.0001] followed by Tukey's HSD post hoc test. Error bars represent ± SEM. *different from intact and shTHscr controls.

