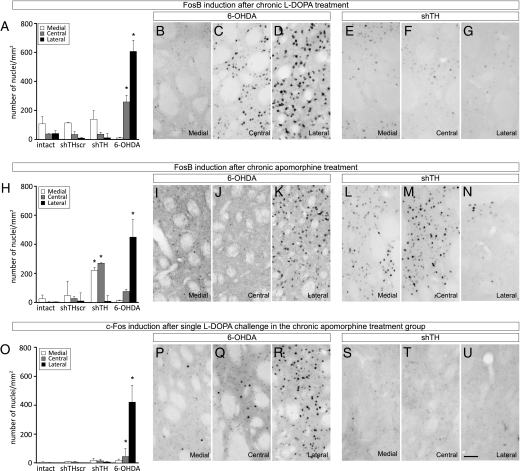
Fig. 5.
Analysis of FosB and c-Fos induction following L-DOPA and apomorphine treatment. The numbers of c-Fos and FosB-positive cells were assessed on three coronal sections in the striatum as shown in Fig. S4. (A–G FosB induction after chronic L-DOPA treatment; (H–N) FosB induction after chronic apomorphine treatment; (O–U) c-Fos induction in the striatum after a single dose 24 mg/kg L-DOPA challenge in the animals that were primed with chronic apomorphine treatment. Note that the FosB and c-Fos photomicrographs in Middle and Bottom rows are taken from adjacent series of sections processed from the same animal. The contrast between 6-OHDA lesions and rAAV5-mediated TH knockdown is illustrated with two panels under each condition representing the medial, central, and lateral striatal expression of the two gene products. Quantification of the FosB (A and H) and c-Fos (O) positive nuclei after chronic L-DOPA (A), chronic apomorphine (H), and acute L-DOPA (O) treatments are illustrated as bar graphs. Statistical comparisons for each striatal area were performed by one-way ANOVA [A, lateral striatum F(3,21) = 47.425, P < 0.0001; central striatum F(3,21) = 6.065, P < 0.05; H, lateral striatum F(3,14) = 8,124, P < 0.005; central striatum F(3,14) = 3.478, P < 0.05; medial striatum F(3,14) = 3,719, P < 0.05; O, lateral striatum F(3,13) = 4.977, P < 0.05] followed by Tukey's HSD post hoc test. Error bars represent ± SEM. *Different from the number of positive-nuclei from the corresponding striatal region in other groups. (Scale bar, 50 μm in U for B–G, I–N and P–U.)

