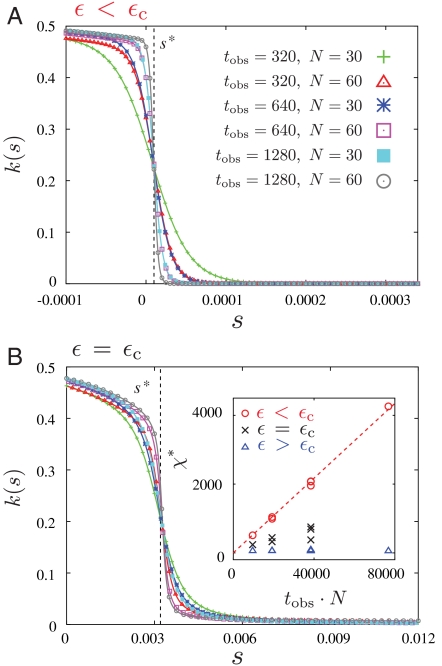
Fig. 4.
Finite-size scaling in the s ensemble. We show the dependence of the mean activity on the biasing field s, for various system sizes and observation times. Dashed vertical lines show the positions of first- and second-order transitions predicted by Eq. 3. (A) Data for ϵ < ϵc, at the state point marked by a circle in Fig. 3 A. (B) Data for ϵ = ϵc, for the state point marked by a cross (×) in Fig. 3 A. The values of N and tobs are the same in A and B. (Inset) The derivative of the activity with respect of the field s, evaluated at s = s∗, for the three state points shown in Fig. 3 A, varying N and tobs.

