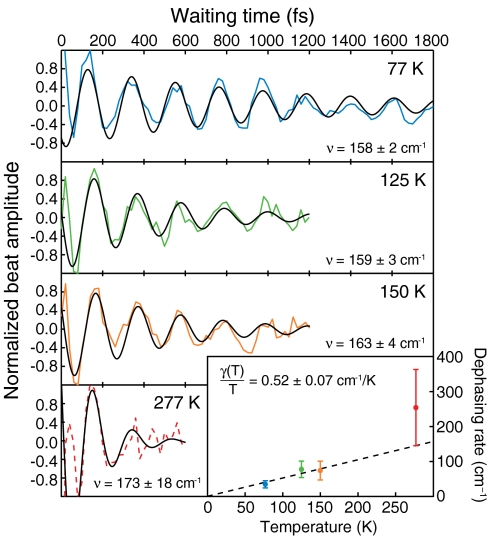
Fig. 3.
Temperature dependence of coherence dephasing. Integrated cross-peak amplitudes are taken from the absolute value of the combined 2D signal (rephasing + nonrephasing) after removal of exponential population decay at 77 K, 125 K, and 150 K (colored solid lines). The amplitude at 277 K is taken from the absorptive portion of the rephasing signal (dashed red line). The beating signals are normalized to their respective maxima and fit to the product of a sine function and an exponential decay (solid black lines). The beating frequency is given for each temperature. The dephasing rate taken from the exponential part of the fit is plotted as a function of temperature along with standard errors in the inset. The statistically weighted linear fit of these points (dashed black line) has a slope of 0.52 ± 0.07 cm-1/K (SD).

