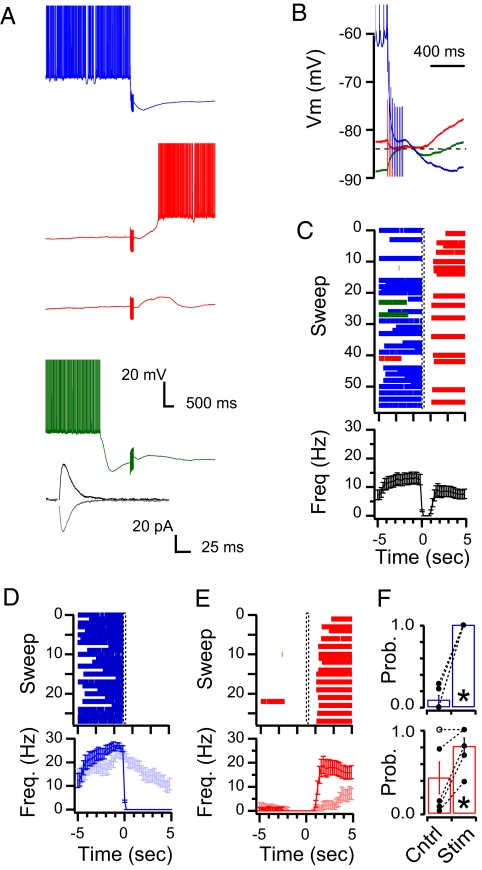
Fig. 3.
Purkinje cells recorded under whole-cell current clamp conditions are switched between states by extracellular stimulation of interneurons. (A) Representative recordings showing the response of one Purkinje cell to interneuron stimulation (10 stimuli at 50 Hz) occurring during an up state (blue), more than 1.0 s after entry into a down state (red) and less than 1.0 s after entry into a down state (green). Note that although they cannot be seen in the raster plots some stimuli do not switch the cell from a down to an up state (second red trace). Action potentials are truncated to show membrane potential. Inset displays averages of single IPSCs recorded at −74 (black) and −89 mV (gray) from the same cell. (B) Time expansion of traces in A to show the polarity of the PSPs in the three conditions: hyperpolarizing in blue and red traces and depolarizing in the green trace. Also note the rebound depolarization in the red trace (dashed line represents EGABA). (C) Raster plot of the action potentials from all traces recorded in the cell shown in A and B. (Lower) Average frequency of action potentials across all traces of the raster plot (stimulation starting at time 0). (D) Raster plot of the action potentials from sweeps in which the cell was in an up state at the time of interneuron stimulation. The average action potential frequency is plotted in the Lower panels with the light blue trace representing the action potential frequency recorded from interleaved controls in which no stimulation was given but the cell was in an up state at time = 0 s. (E) Same as D but for sweeps in which the cell was in a down state at the time of interneuron stimulation. Light red trace represents interleaved controls. (F) The average probability across all cells (n = 7) of a state change occurring at the time of stimulation (time = 0 s) is significantly higher for stimulated sweeps than for interleaved control sweeps in which no stimulation was applied. Upper graph (blue) depicts the probability of up-to-down switches and Lower graph (red) shows the down-to-up transitions.

