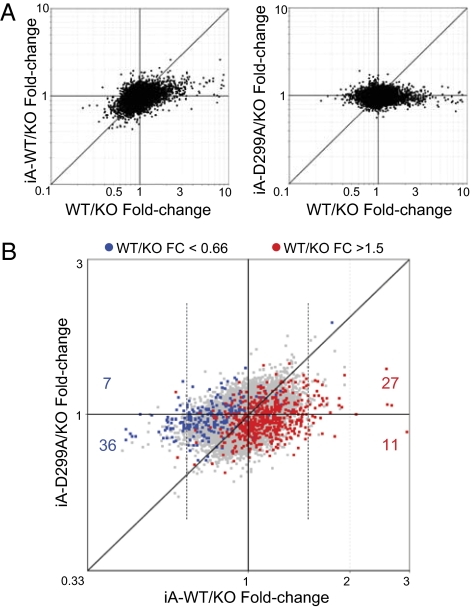
Fig. 2.
Aire-dependent transcripts in iA-WT vs. iA-D299A MECs (A) Scatterplots of gene fold-changes (FCs) induced by iA-WT (y axis) vs. WT Aire (x axis) (Left), or iA-D299A vs. WT Aire (Right) in MECs. (B) Scatterplots of gene FCs induced by iA-D299A (y axis) vs. iA-WT (x axis) in MECs. Red and blue dots indicate Aire-induced or -repressed genes, respectively at a 1.5-FC cutoff from WT/KO MECs. Red dots which also make the 1.5-FC cutoff in iA-WT/KO MECs (vertical dotted line) are enumerated for genes that exhibit iA-D299A/KO FC >1 (red number above x axis), or <1 (red number below x axis). Blue dots that also make the 0.66-FC cutoff in iA-WT/KO MECs are enumerated for genes that exhibit iA-D299A/KO >1 (blue number above x axis), or <1 (blue number below x axis).

