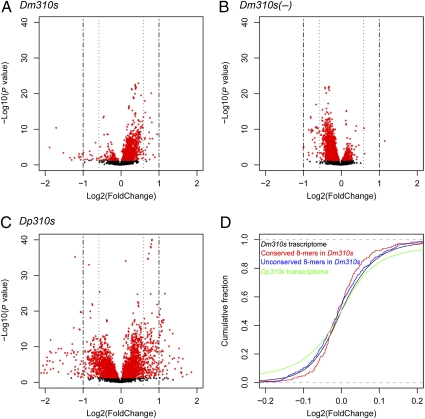
Fig. 3.
Impact of miR310s misexpression on WGE in D. melanogaster. The negative log10-transformed P values of a paired t test (Materials and Methods) are plotted against the log 2-fold change for a total of 19,878 transcripts. (A) Dm310s line. (B) Dm310s(−) line. (C) Dp310s line. Fold change is the ratio of the expression in the experimental line over that in the control. (D) Empirical cumulative distributions of the plots in A (black line) and C (green line). Cumulative distributions of the plots in Fig. 4A (red and blue lines for conserved and unconserved targets, respectively) are also included. Note that the range on the x axis of D is much smaller than that in A–C for the purpose of showing the trend near X = 0. In that small interval, the large number of points in the scattered plot of A–C obscures the pattern.

