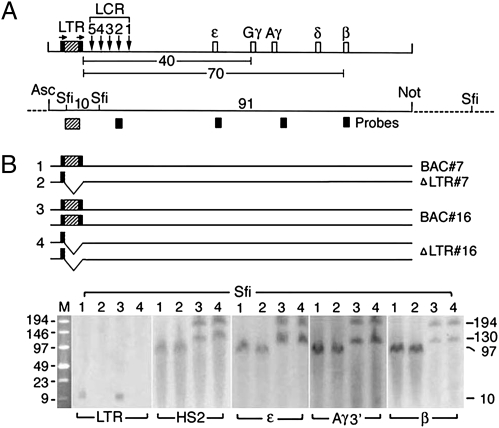
Fig. 1.
Structural analysis of the human β-globin gene locus in Tg mice. (A) (Upper) Map of BAC DNA spanning the 100-kb human globin gene locus. Hatched box flanked by black bars shows the ERV-9 LTR flanked by loxP sites; arrows designate direction of loxP sites, inserted into the BAC DNA by Chi-recBCD-mediated homologous recombination in E. coli (18) (SI Materials and Methods). Vertical arrows, DNase I hypersensitive sites HS 5–1 underlying the cores of the LCR; open boxes, embryonic ε-, fetal Gγ- and Aγ-, and adult δ- and β-globin genes; numbers, distances in kilobases between the LTR and the globin genes. (Lower) Map of restriction enzyme sites in the integrated BAC DNA (solid horizontal line) and the flanking mouse DNA (dotted lines) used for excision of the BAC DNA (AscI and NotI sites) and Southern blots (SfiI sites); numbers, sizes in kilobases of DNA fragments generated by SfiI and NotI digestions; hatched and solid boxes, the LTR, HS2, and the globin gene probes used in Southern blots. (B) (Upper) Horizontal lines grouped under 1, 2, 3, and 4 depict the sizes and copy numbers of the BAC DNA in the parental BAC and the derived ΔLTR Tg mice of lines 7 and 16. (Lower) Southern blots following SfiI digestion and pulsed field gel electrophoresis (PFGE). Lanes 1 and 2 and lanes 3 and 4 show bands generated by BAC and ΔLTR Tg mice of lines 7 and 16, respectively. M, size markers in kilobases; numbers in the right margin, sizes in kilobases of the Southern bands.

