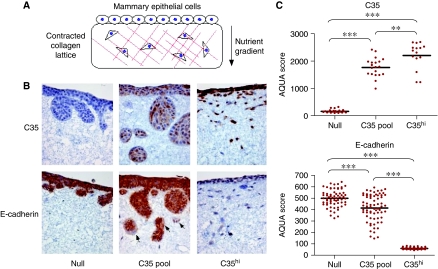
Figure 3.
C35-expression leads to invasive phenotype, associated with epithelial to mesenchymal transition. (A) Schematic illustration of the invasion assay set-up in a collagen gel containing fibroblasts overlaid with epithelial cells. (B) H16N-2 cells expressing empty vector (null, left panels), C35-expressing pool (middle panels) and C35hi-expressing cells were stained by immunohistochemistry for C35 and E-cadherin. Note specific areas of E-cadherin loss in C35 pool (arrows). (C) Quantification of C35 and E-cadherin by AQUA is shown. Bar indicates mean of measurements (P-value indicators: *<0.05; **<0.01; ***<0.001).

