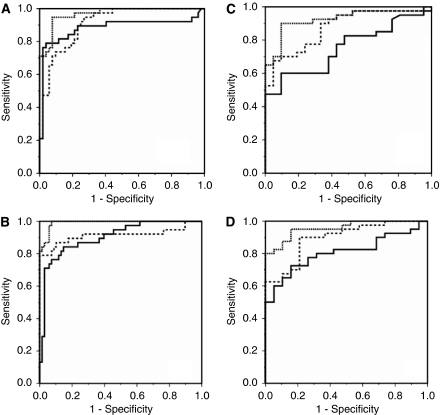
Figure 1.
Receiver operator characteristic (ROC) curves for discrimination of pancreatic adenocarcinoma (PC) from disease controls (DCs) and healthy volunteers (HVs) in both the centre-1 and centre-2 cohorts. The protein panel derived from ten-fold cross-validation (solid line), CA19-9 (dashed line) and biomarker panel + CA19-9 (dotted line). (A) PC vs DC (centre-1): ROC AUC=0.90 for the biomarker panel, 0.87 for CA19-9 and 0.97 for the biomarker panel + CA19-9. (B) PC vs DC (centre-2): ROC AUC=0.88 for the biomarker panel, 0.75 for CA19-9 and 0.93 for the biomarker panel + CA19-9. (C) PC vs HV (centre-1): ROC AUC=0.90 for the biomarker panel, 0.91 for CA19-9 and 0.99 for the biomarker panel + CA19-9. (D) PC vs HV (centre-2): ROC AUC=0.90 for the biomarker panel, 0.81 for CA19-9 and 0.96 for the biomarker panel + CA19-9.

