Figure 3.
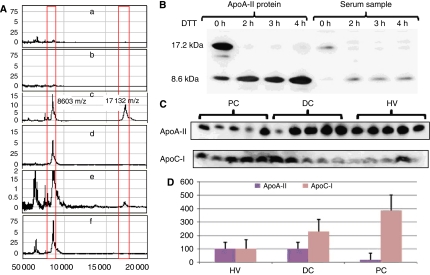
(A) Plots of peak height against m/z for the identification of ApoA-II isoforms using SELDI RS100 profiles. (a) ApoA-II purified human plasma ApoA-II (Sigma-Aldrich) IgG, (b) serum without IgG, (c) purified human ApoA-II on ApoA-II antibody-enriched chip indicating a number if peaks ∼8603 indicating monomer and 17 132 indicating dimer, (d) purified ApoA-II treated with 20 μM DTT for 3 h on antibody-enriched chip, (e) serum on ApoA-II antibody-enriched chip and (f) purified ApoA-II treated with 20 μM DTT for 3 h on antibody-enriched chip. (B) Western blotting analysis of the effect of 0 to 4 h of 20 μM DTT reduction on a serum sample and on purified human plasma ApoA-II. (C) Western blot of the expression of ApoC-I and ∼17 kDa ApoA-II in five pancreatic cancer samples (PC), five disease control samples (DC) and five human volunteer samples (HV). (D) Plot of mean and s.d. band intensity (% of HV) as semiquantified by Pro-Gel scanning (Gel-Pro Analyzer Properties) for PC samples (n=15), DC samples (n=15) and HV samples (n=15).

