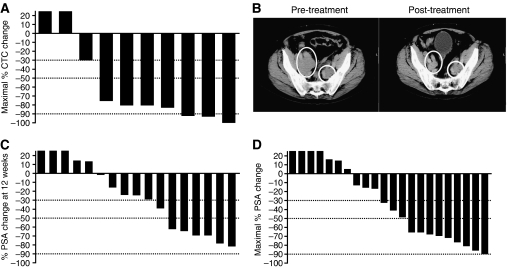
Figure 3.
Efficacy of figitumumab and docetaxel in patients with CRPC. (A) Waterfall plot of maximal CTC declines in individual patients with baseline CTC count of ⩾5 per 7.5 ml, treated with figitumumab and docetaxel. Dotted lines indicate CTC declines of 30, 50, and 90%, respectively. (B) Radiologic response in a patient with metastatic disease to bilateral pelvic nodes. This patient also had extensive retroperitoneal (not shown) and bony metastases with a baseline PSA of 11 291 μg l–1. Bilateral pelvic nodal metastatic deposits are indicated by circles at baseline (pre-treatment image). After four cycles of therapy, nodal disease showed a significant reduction in size (post-treatment image); PSA fell to a nadir of 1578 μg l–1. The patient completed eight cycles of treatment with a maintained radiologic response, but with PSA progression and docetaxel-related fatigue. (C) Waterfall plot of PSA change from baseline to 12 weeks. (D) Waterfall plot of maximal PSA change for individual patients. Dotted lines indicate PSA declines of 30, 50, and 90%. Some patients had a PSA decline on study but this was short lived and PSA then rose again, explaining why the week 12 and maximal PSA declines are different. Abbreviations: CRPC, castration-resistant prostate cancer; CTC, circulating tumour cells; PSA, prostatic-specific antigen.

