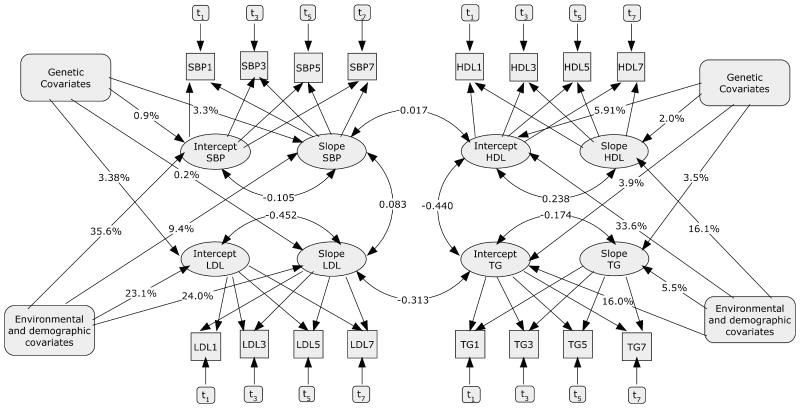
Figure 1. Path diagram describing growth curve parameters (intercept and slope) of repeated measures of SBP, HDL, LDL, and TG made at FHS Exams 1, 3, 5, and 7.
Environmental and demographic covariates, sex, age, baseline BMI and diabetic status; genetic covariates, 10 selected markers. The numbers on the lines connecting these covariates with the intercepts and slopes are percentages of explained variation and correlations. Paths with one arrow indicate causal relationships, whereas those with two show correlations. The ti values represent time varying covariates hypertensive and cholesterol medication as well as number of cigarettes smoked. (Reprinted from Hamid et al. [2009] with permission of the authors. Copyright 2009 by J. S. Hamid, N. M. Roslin, A. D. Paterson, and J. Beyene.)

